

Cross-field strength and multi-vendor reliability of MagDensity for MRI-based quantitative breast density analysis
- PMID: 40554498
- PMCID: PMC12186934
- DOI: 10.1371/journal.pone.0316076
Cross-field strength and multi-vendor reliability of MagDensity for MRI-based quantitative breast density analysis
Abstract
Purpose: Breast density (BD) is a significant risk factor for breast cancer, yet current assessment methods lack automation, quantification, and cross-platform consistency. This study aims to evaluate the reliability and cross-platform consistency of MagDensity, a novel magnetic resonance imaging (MRI)-based quantitative BD measure, across different imaging platforms.
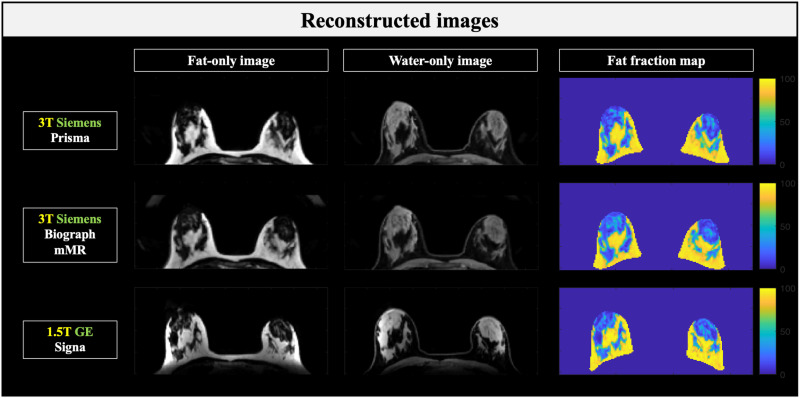
Methods: Ten healthy volunteers participated in this prospective study, undergoing fat-water MRI scans on three scanners: 3T Siemens Prisma, 3T Siemens Biograph mMR, and 1.5T GE Signa. Great effort was made to schedule all scans within a narrow three-hour window on the same day to minimize any potential intra- or inter-day variations, requiring substantial logistical coordination. BD was assessed using the MagDensity technique, which included combining magnitude and phase images, applying a fat-water separation technique, employing an automated whole-breast segmentation algorithm, and quantifying the volumetric water fraction. Agreement between measures across scanners was analyzed using mean differences, two-tailed t-tests, Pearson's correlation, and Bland-Altman analysis.
Results: MagDensity measures obtained from the two 3T Siemens scanners demonstrated no statistically significant differences, with high correlation (Pearson's r > 0.99) and negligible mean differences (< 0.2%). Cross-platform comparison between the 3T Siemens and the 1.5T GE scanners showed larger mean differences (< 4.2%). However, after applying linear calibration, these variations were reduced to within ±0.2%, with strong inter-scanner correlation maintained (Pearson's r > 0.97).
Conclusion: MagDensity showed strong intra-vendor consistency and promising cross-platform reliability after leave-one-out calibration. While full standardization remains a long-term goal, these findings provide clear evidence that scanner-related variability can be effectively mitigated through calibration. This technique offers a step further toward more consistent MRI-based BD quantification and may help enable broader clinical implementation.
Copyright: © 2025 Ying et al. This is an open access article distributed under the terms of the Creative Commons Attribution License, which permits unrestricted use, distribution, and reproduction in any medium, provided the original author and source are credited.
Conflict of interest statement
The authors have declared that no competing interests exist.
Figures


Similar articles
-
Cost-effectiveness of using prognostic information to select women with breast cancer for adjuvant systemic therapy.Health Technol Assess. 2006 Sep;10(34):iii-iv, ix-xi, 1-204. doi: 10.3310/hta10340. Health Technol Assess. 2006. PMID: 16959170
-
Eliciting adverse effects data from participants in clinical trials.Cochrane Database Syst Rev. 2018 Jan 16;1(1):MR000039. doi: 10.1002/14651858.MR000039.pub2. Cochrane Database Syst Rev. 2018. PMID: 29372930 Free PMC article.
-
Systemic pharmacological treatments for chronic plaque psoriasis: a network meta-analysis.Cochrane Database Syst Rev. 2021 Apr 19;4(4):CD011535. doi: 10.1002/14651858.CD011535.pub4. Cochrane Database Syst Rev. 2021. Update in: Cochrane Database Syst Rev. 2022 May 23;5:CD011535. doi: 10.1002/14651858.CD011535.pub5. PMID: 33871055 Free PMC article. Updated.
-
A rapid and systematic review of the clinical effectiveness and cost-effectiveness of topotecan for ovarian cancer.Health Technol Assess. 2001;5(28):1-110. doi: 10.3310/hta5280. Health Technol Assess. 2001. PMID: 11701100
-
Drugs for preventing postoperative nausea and vomiting in adults after general anaesthesia: a network meta-analysis.Cochrane Database Syst Rev. 2020 Oct 19;10(10):CD012859. doi: 10.1002/14651858.CD012859.pub2. Cochrane Database Syst Rev. 2020. PMID: 33075160 Free PMC article.
References
MeSH terms
LinkOut - more resources
Full Text Sources
Medical
