. 2025 Jul 15;152(14):dev204373.
doi: 10.1242/dev.204373. Epub 2025 Jul 16.

miR-137 targets Myc to regulate growth during eye development

Affiliations

miR-137 targets Myc to regulate growth during eye development

Radhika Padma et al. Development. .

Abstract

During development, regulation of gene expression is key to cellular homeostasis. Gene expression regulation by non-coding RNAs involves the prevention of mRNA accumulation or the inhibition of translation of their target gene. In a forward-genetic screen to identify the microRNA involved in the growth and patterning of the Drosophila eye, we identified the highly conserved miR-137. Gain of function of miR-137 results in a reduced-eye phenotype by downregulating retinal determination and differentiation markers, and by upregulating negative regulators of eye development, such as Wingless (Wg) and Homothorax (Hth). Loss of function of miR-137 results in an enlarged-eye phenotype. Using bioinformatics and genetic approaches, we identified the oncogene Myc as the target of miR-137. Gain of function of Myc can rescue the reduced-eye phenotype of miR-137 gain of function, and vice versa. We tested the role of miR-137 in regulating Myc levels in the RasV12;scribRNAi, a tumor model of oncogenic cooperation that results in neoplastic tumors. Gain of function of miR-137 in the RasV12;scribRNAi background significantly reduced tumor phenotype as well as Myc levels in the eye. Our studies highlight miR-137 as a post-transcriptional regulator of Myc and a promising therapeutic target for diseases associated with Myc accumulation.

Keywords: Drosophila; Myc; Cell death; Cell proliferation; Eye development; Retina; Retinal determination; miR-137; miRNA.


Conflict of interest statement

Competing interests The authors declare no competing or financial interests.

Figures
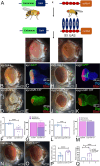
Fig. 1.
Fig. 1.
Screening for miRNA involved in eye development results in the identification of miR-137. (A) The screening strategy to identify miRNA(s) involved in eye development. In the developing eye, individual miRNA(s) are misexpressed using the Gal4/UAS Target system, and their effect on eye phenotype is assayed. (B) The adult eye of an ey-Gal4 control, to which misexpressed miRNA(s) phenotypes were compared. (C) The domain of expression (UAS GFP, green) of ey-GAL4 in the third-instar larval eye-antennal imaginal disc stained for Discs large (Dlg, blue), to mark cellular outlines, and Elav (red), to mark photoreceptor neurons. (D,E) Gain of function of miR-137 in the developing eye using ey-Gal4 driver (ey>miR-137) results in the reduced-eye phenotype, as seen in (D) adults and (E) larval eye imaginal disc. (F,L,P) Quantification of adult eye surface area (μm2) using Fiji/ImageJ software with statistical analysis of normalized adult eye surface area (150 pixels/inch) carried out using an unpaired Student's t-test. The analyzed area is indicated with white dotted lines for denoted genotypes (B,D,H,J) (n=10). (G,M) Adult eye phenotype frequency of indicated genotypes (n=200, three replicates). Analysis was carried out using a two-way ANOVA with Sidak's multiple comparison test. (H) Adult eye of the eyg-Gal4 driver serves as a control. (I) The third-instar larval eye-antennal imaginal disc showing eyg-Gal4 expression (UAS-GFP, green). (J,K) eyg>miR-137 exhibits the reduced-eye phenotype in (J) adult and (K) larval eye imaginal disc. (N,O) Adult eyes of Canton-S control (N) and miR-137KO homozygous (O) flies, which exhibit an enlarged eye phenotype. (Q) The log2 fold-change values of miR-137 normalized to 2S-rRNA in ey-Gal4, ey>miR-137 and miR-137KO. Pairwise comparisons were made with an unpaired t-test. miR-137 is expressed in the developing eye. All graphs were plotted using GraphPad Prism 8.3.1. Data are mean±s.e.m. Statistical significance is indicated in each graph: ****P<0.0001; **P<0.01; *P<0.05; ns, non-significant. Orientation of all the imaginal discs is posterior to the left and dorsal upwards. All eye-antennal imaginal discs were captured at 20× magnification and adult eyes at 10× magnification, unless specified otherwise. Scale bars: 100 µm.
Fig. 2.
Fig. 2.
Gain of function of miR-137 downregulates retinal determination and retinal differentiation genes. (A-F″) Expression of the retinal determination genes (A-C″) Eya (green) and (D-F″) Dac in eye-antennal imaginal disc of (A,A′,D,D′) ey-Gal4, (B,B′,E,E′) ey>miR-137 and (C-C″,F-F″) hsFLP-out clones of miR-137. (A′,B′,C′,D′,E′,F′) Single channel images for (A′,B′,C′) Eya and (D′,E′,F′) Dac. Elav (red) marks the retinal neuron. (B,B′) Eya and (E,E′) Dac expression is downregulated posterior to the MF in the ey>miR-137 background, which exhibits a reduced-eye phenotype. FLP-out clones showed abnormal spacing between neighboring photoreceptors and exhibited downregulation of (C,C′) Eya and (F,F′) Dac. (C″,F″) Elav indicates where retinal neurons are affected. (G-L″) Expression of a retinal differentiation genes (G-I″) Ato (green) and (J-L″) Sca (green) in eye-antennal imaginal disc of (G,G′,J,J′) ey-Gal4 control, (H,H′,K,K′) ey>miR-137 and (I,I′,I″,L,L′,L″) FLP-out clones of miR-137. (G′,H′,I′,J′,K′,L′) Single channel images for (G′,H′,I′) Ato and (J′,K′,L′) Sca. (H,H′) Ato and (K,K′) Sca expression is downregulated in MF in the ey>miR-137 background and a similar observation was seen in (I,I′,L,L′) hsFLP-out clones. All the imaginal discs are oriented posterior to the left and dorsal upwards. All eye-antennal imaginal discs were captured at 20× magnification, unless specified otherwise. Scale bars: 100 µm.
Fig. 3.
Fig. 3.
Gain of function of miR-137 blocks morphogenetic furrow progression and ectopically induces the negative regulators of eye fate. (A-C′) Eye-antennal imaginal discs stained for the dpp-LacZ reporter (green), which marks the morphogenetic furrow (MF) in the (A,A′) ey-Gal4 (control) and (B,B′) ey>miR-137 background, and in (C,C′) heat shock FLP-out clones of miR-137 in the developing eye imaginal disc. Elav (red) marks the retinal neuron. (A′,B′,C′) Single channel images for dpp-lacZ expression. dpp-lacZ is significantly downregulated in ey>miR-137 background (marked by arrow in C′) when compared to the control and in FLP-out clones. dpp-LacZ is downregulated in the border of the clone and does not extend to the dorsal margin (marked by arrows in B,D,H). (D-I″) Eye-antennal imaginal disc of third-instar larvae stained for (D-F″) Wg and (G-I″) Hth. (D-F″) Wg (green), a negative regulator of MF progression, is ectopically induced in (E,E′) the ey>miR-137 background and in (F,F′) the FLP-out clone of miR-137 (outlined in yellow) in comparison to the control (D,D′) ey-Gal4. (G-I″) Hth (green), a head fate marker and negative regulator of eye fate, is ectopically induced in (H,H′) the ey>miR-137 background and in (I-I″) the FLP-out clone of miR-137 (outlined in yellow) in comparison to the control (G,G′) ey-Gal4. (D′,E′,F′,G′,H′,I′) Single channel images for (D′,E′,F′) Wg and (G′,H′,I′) Hth. All the imaginal discs are oriented posterior to the left and dorsal upwards. All eye-antennal imaginal discs were captured at 20× magnification, unless specified otherwise. Scale bars: 100 µm.
Fig. 4.
Fig. 4.
Gain of function of miR-137 triggers cell death in the developing eye. (A-B′,D-E′,G-H′) Eye-antennal imaginal discs of third-instar larvae stained for Elav (red), (A-B′) Dcp1 (green, a marker for apoptotic cells), (D-E′) hid5′-WT-GFP (green, a proapoptotic gene, hid reporter) and (G-H′) TUNEL (green, a marker for dying cells nuclei) in (A,A′,D,D′,G,G′) ey-Gal4 and (B,B′,E,E′,H,H′) ey>miR-137 background. Single channel images for (A′,B′) Dcp-1, (D′,E′) hid5′-WT-GFP and (G′,H′) TUNEL alone. (C,F,I) Statistical analysis showed that ectopic expression of miR-137 (ey>miR-137) exhibits a significant increase in (C) Dcp-1, (F) hid5′-WT-GFP and (I) TUNEL-positive nuclei as compared to the ey-Gal4 controls as shown in the graphs. The signal intensity was calculated in three regions of interest per disc within a sample of n=5 for each genotype. (J-M) Ectopic expression of baculovirus P35, which blocks cell death, in (J,K) ey-Gal4 (ey>P35, control) and (L,M) ey>miR-137 (ey>miR-137+P35) background. P35 rescues the ey>miR-137 reduced-eye phenotype, as seen in (L) eye imaginal disc and (M) adult eye. (N) Statistical analysis showed a decrease in Dcp1-positive cells. Dcp1-positive cells were calculated in a sample of n=5 for each genotype. (C,F,I,N) The statistical analysis was carried out using an unpaired Student's t-test. Data are mean±s.e.m. Statistical significance is indicated in each graph: ***P<0.001; **P<0.01; *P<0.05. All graphs were plotted using GraphPad Prism 8.3.1. All the imaginal discs are oriented posterior to the left and dorsal upwards. All eye-antennal imaginal discs were captured at 20× magnification and adult eyes at 10× magnification, unless specified otherwise. Scale bars: 100 µm.
Fig. 5.
Fig. 5.
The gain-of-function phenotype of miR-137 does not exhibit domain constraint. (A-D) Gain of function of miR-137 in the dorsal half of the adult eye (A,C, marked by white dotted lines) using the DE-Gal4 driver (domain marked by GFP reporter) marked by expression of mini-white reporter (red, white dotted line outlines the domain). (C,D) The gain of function of miR-137 in the background of DE-Gal4 (DE>miR-137) reduces the dorsal domain of the eye field in (C) the adult eye and (D) the eye-imaginal disc. (B,D) Eye-antennal imaginal disc of third-instar larvae stained for Elav (red), Dlg (blue) and GFP (green) reporter. (E) Dorsal half expression of DE>miR-137 (n=10) normalized to the control DE-Gal4 (n=10). (E) The bar graph shows the length of the dorsal half of eye in DE>miR-137 (n=10) normalized to the control, DE-Gal4 (n10). (F,H) Adult wings of (F) nub-Gal4 and (H) nub>miR-137. The wings of nub>miR-137 (H) are reduced when compared to the control (F) nub-Gal4. (G,I) Wing imaginal discs of (G) nub-Gal4 and (I) nub>miR-137 stained for Engrailed (En) (red, a posterior compartment fate marker) and GFP (green, reporter marks nub-Gal4 expression domain). (J) A nub-Gal4 expression domain in the wing disc (n=5) of nub>miR-137 normalized to control nub-Gal4 (n=5). The nub-Gal4 domain is significantly reduced in the nub>miR-137 background. Data are mean±s.e.m. Statistical significance is indicated in each graph: ****P<0.0001; **P<0.01. All graphs were plotted using GraphPad Prism 8.3.1. All eye-antennal imaginal discs were captured at 20× magnification and adult eyes at 10× magnification, unless specified otherwise. Scale bars: 100 µm.
Fig. 6.
Fig. 6.
Screening for miR-137 gene target(s) identified Myc. (A) The miR-137 binding site on its target(s) predicted by the bioinformatic tools TargetScan and DIANA. (B-H) Loss-of-function phenotypes in the adult eye of the putative targets identified using bioinformatics approaches. Adult eye phenotypes of (B) dcr2; ey-Gal4 (control), (C) dcr; ey>MycRNAi, (D) dcr; ey>Inx2RNAi, (E) dcr; ey>biRNAi, (F) dcr; ey>msiRNAi, (G) dcr; ey>mei-P26RNAi and (H) dcr; ey>scrtRNAi. In these experiments, dcr2 is co-expressed in the ey expression domain for a stronger RNA interference effect. (C) dcr; ey>MycRNAi and (D) dcr; ey>Inx2RNAi exhibit a strong reduction in eye size when compared to the control (B). (I) The normalized eye-surface area of miR-137 targets (n=10 per genotype) compared to the control dcr; ey-Gal4. The statistical analysis was performed using a one-way ANOVA with Dunnett's multiple comparison test. (J) Relative transcriptional (expression) levels of Myc (from triplicate sets) obtained using quantitative PCR (qPCR) in ey-Gal4 and ey>miR-137 backgrounds. Statistical analysis was carried out using an unpaired Student's t-test for independent samples. (K) Eye-antennal imaginal disc of third-instar larvae stained for Elav (red), Dlg (blue) a membrane-specific marker and GFP (green) reporter expressing in ey-Gal4 domain. (L,M) The Tubulin–GFP–miR-137 sensor shows ubiquitous expression of GFP under the control of tubulin promoter in the eye discs (L) and the ey>miR-137+miR-137-sensor (ey>miR-137+sensor) shows reduced GFP fluorescence in ey-producing cells the eye discs (M). (N) Quantification of GFP shows a significant reduction in GFP intensity in ey>miR-137+miR-137-sensor eye discs when compared to the control. The statistical analysis was carried out using an unpaired Student's t-test. Data are mean±s.e.m. Statistical significance is indicated in each graph: ****P<0.0001; ***P<0.001; **P<0.01. All graphs were plotted using GraphPad Prism 8.3.1. All eye-antennal imaginal discs were captured at 20× magnification and adult eyes at 10× magnification unless specified otherwise. Scale bars: 100 µm.
Fig. 7.
Fig. 7.
miR-137 targets Myc during eye development. (A-B′) Gain of function of Myc (ey>Myc) (A,A′) and miR-137 (ey>miR-137) (B,B′) in (A,B) adult eye and (A′,B′) eye imaginal disc. (C′,D′) Eye-antennal imaginal discs stained for Elav, a pan-neuronal marker (red), and Dlg, a membrane-specific marker (green). (C-D′) Modulation of Myc levels in ey>miR-137 background using (C,C′) gain of function of Myc (ey>miR-137+Myc) and (D,D′) loss of function of Myc (ey>miR-137+MycRNAi), as seen in (C,D) adult eye and (C′,D′) eye imaginal disc. (E) The normalized eye-surface area of (A) ey>Myc, (B) ey>miR-137, (C) ey>miR-137+Myc and (D) ey>miR-137+MycRNAi showed a significant increase in eye size in ey>miR-137 +Myc compared to controls (ey>miR-137, n=10 per genotype). (F) Statistical analysis of adult eye phenotype frequency between (B) ey>miR-137 and (C) ey>miR-137+ Myc. There was significant rescue seen in ey>miR-137+ Myc when compared to ey>miR-137. (G-H′) Loss of function of miR-137 in (G,G′) ey-Gal4 (miR-137KO, ey-Gal4) and (H,H′) ey>Myc (miR-137KO, ey>Myc) background produces a wild-type phenotype in (G,H) adult eye and (G′,H′) eye imaginal disc. (I-J′) Loss of function of Myc in (I,I′) miR-137KO (ey>miR-137KO+MycRNAi) and (J,J′) ey-Gal4 (ey>MycRNAi) background, as seen in (I,J) adult eye and (I′,J′) eye imaginal disc, produces a reduced-eye phenotype. (K) Statistical analysis of adult eye phenotype frequency in (J) ey>MycRNAi and (D) ey>miR-137+MycRNAi. The reduced-eye phenotype is classified into: (1) 1° reduced eye, representing reduced eye in one or both of the eyes (blue); (2) 2° reduced eye, representing highly reduced to no eye in one of the eyes (purple); and (3) 3° reduced eye, representing highly reduced to no eye in both the eyes (pink). (L) The normalized eye-surface area of ey-Gal4 (Fig. 1B,C), miR-137KO/+, ey-Gal4 (G,G′), miR-137KO/+, ey>Myc (H,H′), miR-137KO/+, ey>MycRNAi (I,I′) and dcr; ey>MycRNAi (J,J′). (M-O) Eye-antennal imaginal disc of (M) Canton-S, (N) miR-137KO and (O) miR-137CR stained for Elav (red) and Myc (green). (P) Mean integrated density of Myc levels from Canton-S (M), miR-137KO (N) and miR-137CR (O). The signal intensity of Myc was calculated in five regions of interest per disc within a sample of n=5 for each genotype. Myc intensity was significantly increased in miR-137KO and miR-137CR. (Q-Q″) Eye-antennal imaginal disc of (Q) random flp out clones of miR-137sp (hsFLP; Act>miR-137sp+ GFP) stained for Elav (red) and Myc (blue). (Q′) Single channel image of GFP marking the clones of miR-137sp. (Q′′) Single channel image of Myc. Myc intensity was dramatically increased with flp out clones of miR-137sp. (R) Mean integrated density of Myc levels between control and flp out clones of miR-137sp. The signal intensity of Myc was calculated at the ROI (50×50) of flp out clones (n=5) and non-flp out (n=5) of the same disc. Myc intensity was significantly increased in hsFLP-out clones of miR-137sp. One-way ANOVA with Tukey's multiple comparison test was used for comparing more than two groups, and an unpaired Student's t-test was used to compare two groups. For adult frequency analysis, three replicates of 200 flies (200×3=600) were used to calculate the frequency of each genotype. Data are mean±s.e.m. Statistical significance is indicated in each graph: ****P<0.0001; ***P<0.001; **P<0.01; *P<0.05. All eye-antennal imaginal discs were captured at 20× magnification and adult eyes at 10× magnification unless specified otherwise. Scale bars: 100 µm.
Fig. 8.
Fig. 8.
miR-137 exhibits growth regulation function in the developing eye. (A,D) Eye imaginal disc (A) and adult eye (D) of ey-Gal4 control. (B,E) ey>RasV12+ scribRNAi serves as a model for oncogenic cooperation resulting in neoplastic tumors and overgrowth. (C,F) Gain of function of miR-137: ey>miR-137+ RasV12+ scribRNAi significantly rescues the overgrowth phenotype of (B,E) ey> RasV12+ scribRNAi both at the eye imaginal disc level and in the adult eye. (A-C) All eye-imaginal discs are stained for Myc (green) and Elav (red). (G) Statistical analyses of normalized adult eye surface area (pixels/inch) were carried out using one-way ANOVA with Tukey's multiple comparison test for (A) ey-Gal4, (C) ey> RasV12+ scribRNAi and (E) ey> miR-137+RasV12+ scribRNAi (n=10 per genotype). The eye surface is reduced by gain of function of miR-137 in the ey> RasV12+ scribRNAi background. (H) Average intensity of Myc levels within the three backgrounds: (1) ey-Gal4, (2) ey> RasV12+ scribRNAi and (3) ey>miR-137+ RasV12+ scribRNAi. The signal intensity of Myc was calculated in three region of interest per disc within a sample of n=5 for each genotype. Statistical analysis was performed using an unpaired Student's t-test for independent samples. Myc intensity was significantly reduced in the ey>miR-137+ RasV12+ scribRNAi background. (I) Relative transcriptional (expression) levels of Myc using the quantitative real-time PCR (qRT-PCR) in ey-Gal4, ey>RasV12+scribRNAi and ey> RasV12+scribRNAi+miR-137 backgrounds. Statistical analysis was carried out in triplicate, using an unpaired Student's t-test for independent samples. Myc transcript levels were significantly increased in ey>RasV12+scribRNAi compared to ey-Gal4 and decreased in ey> RasV12+scribRNAi+miR-137 background compared to ey-Gal4. (J,K) Eye-antennal imaginal disc of (J) ey-Gal4 and (K) ey>miR-137 stained for phospho-histone 3 (pH3) (green, a marker for cell division) and Elav (red). (L) Statistical analysis of pH3 counts in the retinal field marked by Elav in comparable region of interest in ey-Gal4 (n=5) and ey>miR-137 (n=5) shows a significant difference in proliferating cells between control and ey>miR-137. The statistical analysis was carried out using an unpaired Student's t-test. Quantification of pH3 and eye-surface area was calculated using Fiji/ImageJ software to assay the differences. Data are mean±s.e.m. Statistical significance is indicated in each graph: ****P<0.0001; ***P<0.001; **P<0.01; *P<0.05. All graphs were plotted using GraphPad Prism 8.3.1. All the imaginal discs are oriented posterior to the left and dorsal upwards. All eye-antennal imaginal discs were captured at 20× magnification and adult eyes at 10× magnification unless specified otherwise. Scale bars: 100 µm.
Fig. 9.
Fig. 9.
A model to demonstrate the role of miR-137 in growth regulation by targeting Myc during eye development. (A) When miRNAs are expressed at normal levels, a normal eye is produced. (B) Gain of function of miR-137 in the ey-Gal4 domain (ey>miR-137) results in a reduced-eye phenotype. Our results indicate that miR-137 targets Myc to reduce the size of eye. (C) miR-137 targets Myc to regulate growth during development. Gain of function of miR-137 can rescue overgrowth phenotypes observed in the tumor model of oncogenic cooperation in Drosophila. (D) Our results show that miR-137 targets Myc to regulate cell proliferation and cell death in the developing eye and in other tissues.

Similar articles

References

    1. Althoff, K., Beckers, A., Odersky, A., Mestdagh, P., Köster, J., Bray, I. M., Bryan, K., Vandesompele, J., Speleman, F., Stallings, R. L.et al. (2013). MiR-137 functions as a tumor suppressor in neuroblastoma by downregulating KDM1A. Int. J. Cancer 133, 1064-1073. 10.1002/ijc.28091 - DOI - PubMed
    1. Ambros, V. and Ruvkun, G. (2018). Recent molecular genetic explorations of Caenorhabditis elegans microRNAs. Genetics 209, 651-673. - PMC - PubMed
    1. Ambros, V., Bartel, B., Bartel, D. P., Burge, C. B., Carrington, J. C., Chen, X., Dreyfuss, G., Eddy, S. R., Griffiths-Jones, S., Marshall, M.et al. (2003). A uniform system for microRNA annotation. RNA 9, 277-279. 10.1261/rna.2183803 - DOI - PMC - PubMed
    1. Atkins, M., Potier, D., Romanelli, L., Jacobs, J., Mach, J., Hamaratoglu, F., Aerts, S. and Halder, G. (2016). An ectopic network of transcription factors regulated by Hippo signaling drives growth and invasion of a malignant tumor model. Curr. Biol. 26, 2101-2113. 10.1016/j.cub.2016.06.035 - DOI - PubMed
    1. Baker, N. E., Mlodzik, M. and Rubin, G. M. (1990). Spacing differentiation in the developing Drosophila eye: a fibrinogen-related lateral inhibitor encoded by scabrous. Science 250, 1370-1377. 10.1126/science.2175046 - DOI - PubMed

MeSH terms