. 2025 Sep:67:101199.
doi: 10.1016/j.neo.2025.101199. Epub 2025 Jun 23.

Regulatory mechanisms of the Hippo/YAP axis by G-protein coupled estrogen receptor in gastric signet-ring cell carcinoma

Affiliations

Regulatory mechanisms of the Hippo/YAP axis by G-protein coupled estrogen receptor in gastric signet-ring cell carcinoma

Yufei Wang et al. Neoplasia. 2025 Sep.

Abstract

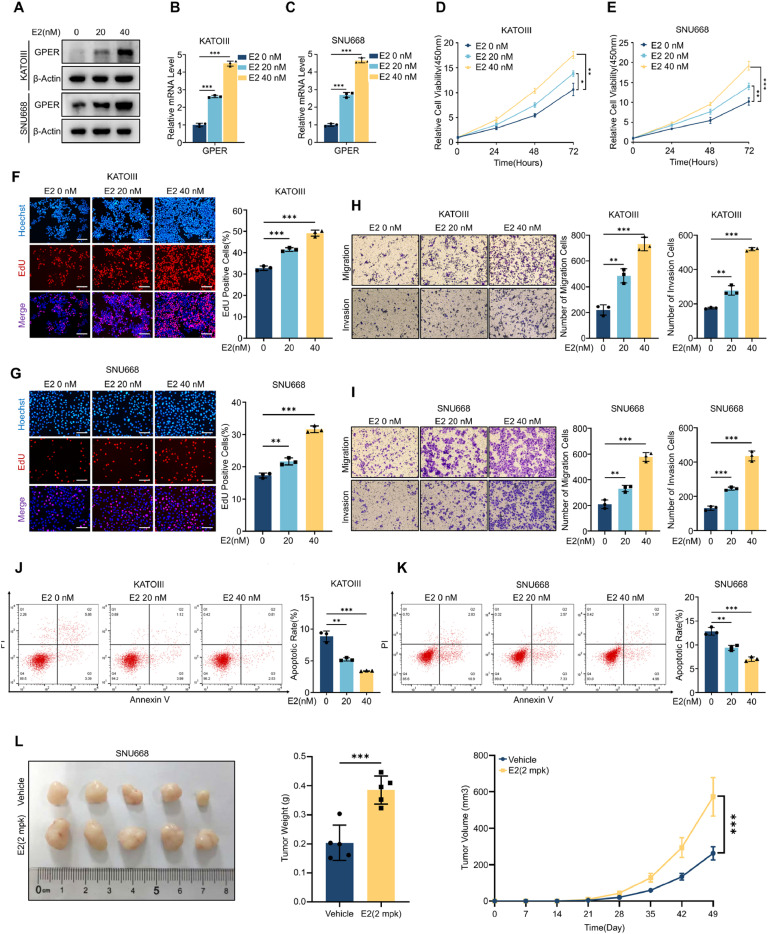
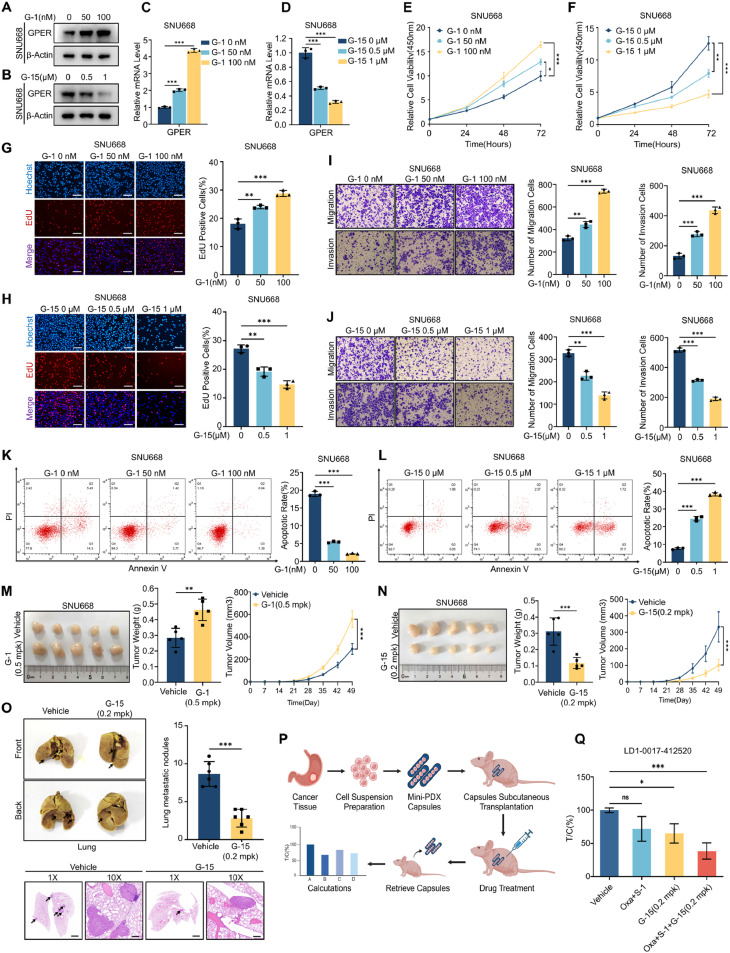
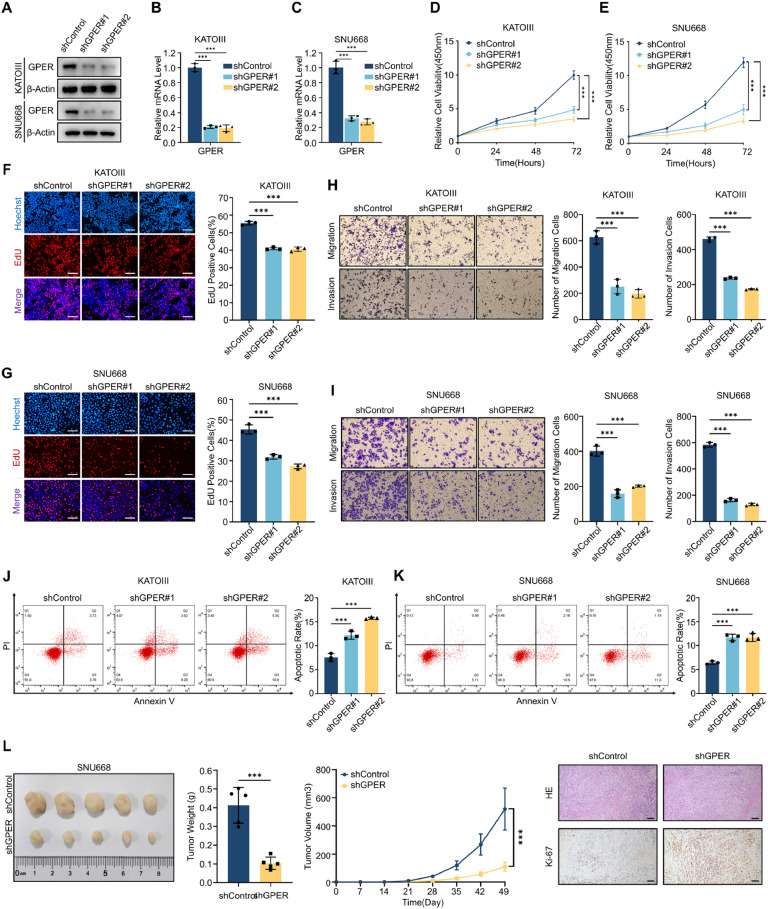
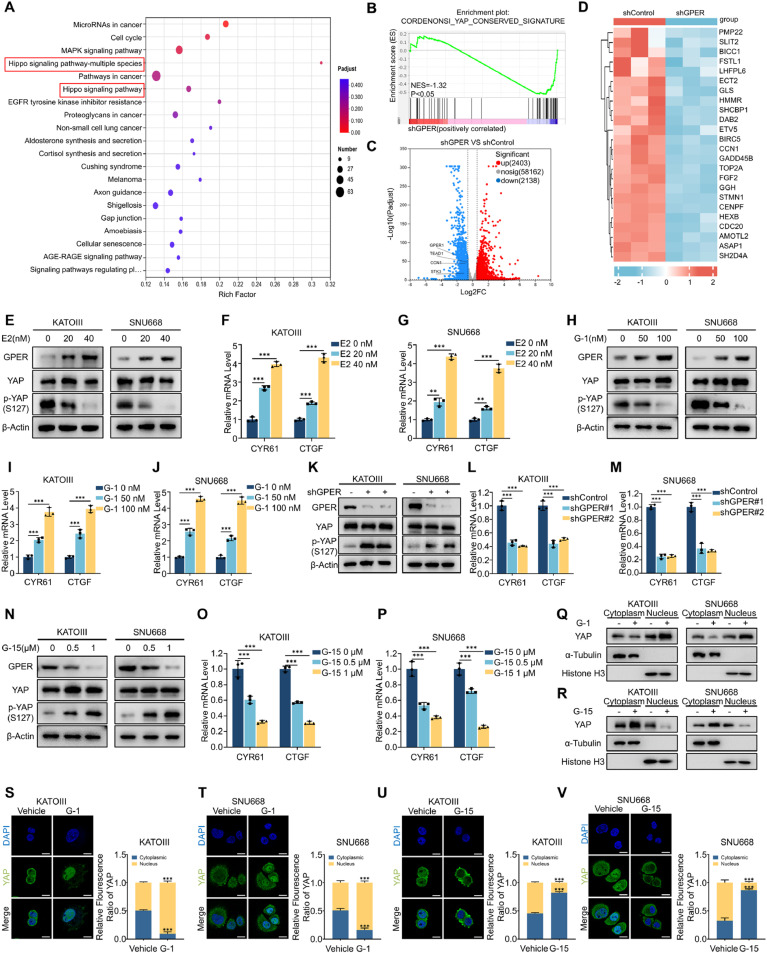
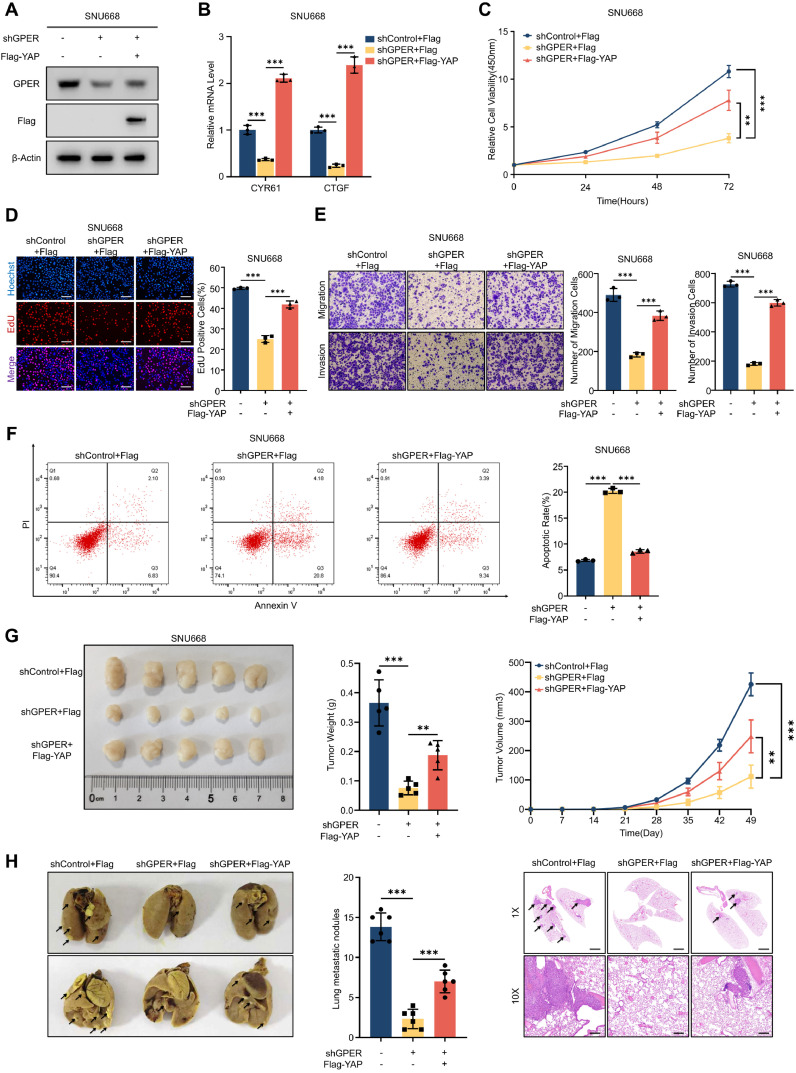
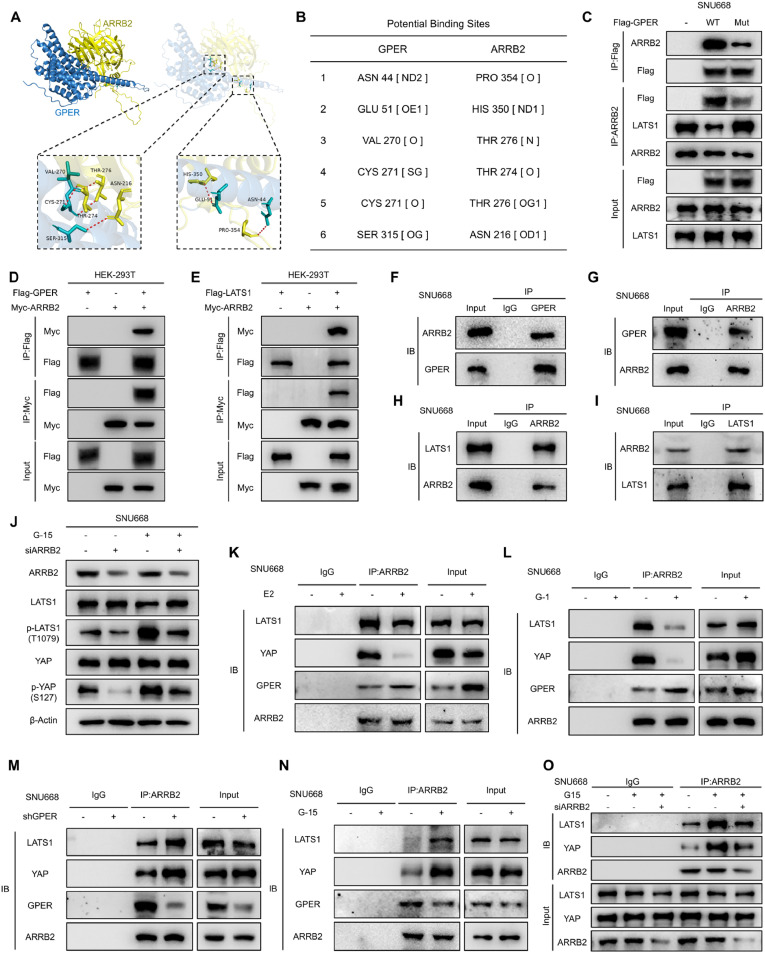
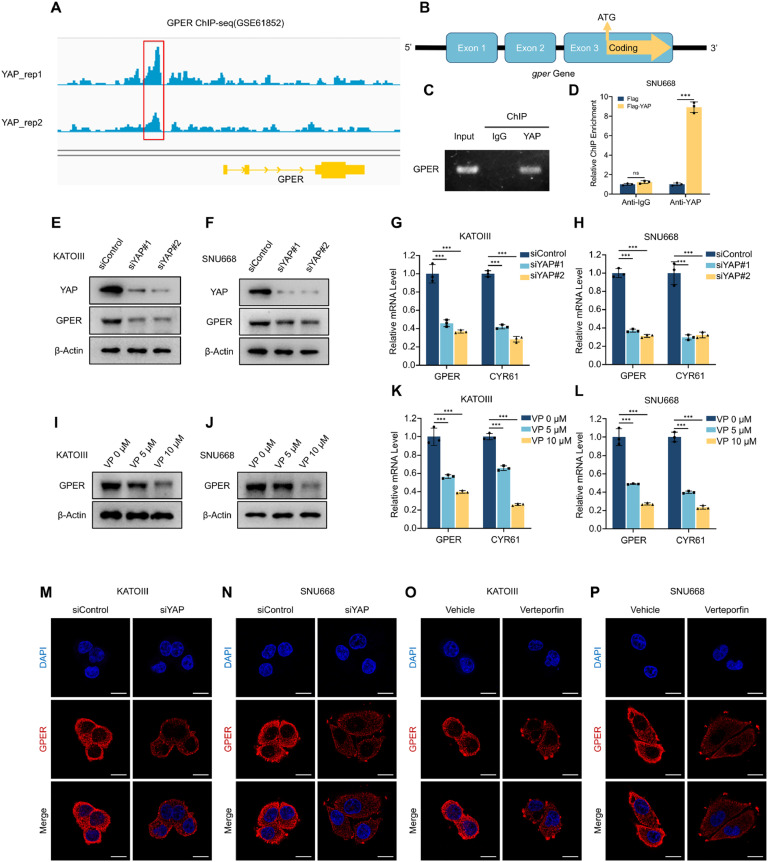
Although aberrant activation of the Hippo/YAP axis has been implicated in the development of gastric cancer, functional studies of this cascade in the context of gastric signet-ring cell carcinoma (GSRC) remain absent. Our previous single-cell sequencing results showed that G protein-coupled estrogen receptor (GPER) is overexpressed in GSRC, and this overexpression is associated with aberrant activation of the Hippo/YAP axis. In this study, we integrated in vitro cytological functional assays with GSRC cell lines and in vivo xenograft nude mice models to elucidate the functional implications of GPER in GSRC. The overexpression of GPER was identified as being associated with more unfavorable outcomes in GSRC. Its activation facilitated tumor proliferation by YAP nuclear translocation and subsequent transcriptional activation. Mechanistically, GPER inhibited LATS1-mediated YAP phosphorylation by competitively binding to ARRB2, thereby enhancing YAP activity. Moreover, YAP was shown to bind to the GPER promoter, forming a positive feedback loop that reinforced oncogenic signaling. Pharmacological inhibition of GPER using G-15 reduced YAP activation and effectively attenuated tumor aggressiveness, highlighting the GPER-YAP feedback loop as a potential therapeutic target for GSRC. This study underscores the pivotal role of the GPER-YAP positive feedback loop in GSRC and proposes dual inhibition of GPER and YAP as a promising therapeutic strategy for GSRC.

Keywords: Carcinogenesis; G protein-coupled estrogen receptor; Gastric signet-ring cell carcinoma; Hippo/YAP axis; Positive feedback loop.


Conflict of interest statement

Declaration of competing interest The authors declare the following financial interests/personal relationships which may be considered as potential competing interests: Jie Chai reports financial support was provided by National Natural Science Foundation of China. If there are other authors, they declare that they have no known competing financial interests or personal relationships that could have appeared to influence the work reported in this paper.

Figures

Image, graphical abstract
Graphical abstract
Fig. 1
Fig. 1
GPER correlates with the aberrant activation of the estrogen signaling in GSRC. (A-B) Analysis of single-disease database of Shandong Cancer Hospital showed that GSRC incidence was higher among females compared to males. (C) Log-Rank test revealed that GSRC patients had a worse prognosis than other GC subgroups (P = 0.004). (D) Log-Rank test revealed that female GSRC patients had worse prognoses compared to male GSRC patients (P = 0.01). (E) Abnormal functional enrichment of the oestrogen signalling pathway was shown by KEGG pathway enrichment analysis for upregulated differentially expressed genes in GSRC single-cell clusters. (F) Immunohistochemical analyses of ERα, ERβ, and GPER expression in mixed GSRC and GC samples. (G) Immunohistochemical analyses of ERα, ERβ, and GPER expression in M/PDA and GSRC samples. (H) Western blotting experiments were used to investigate GPER, ERα, and ERβ protein expression levels in M/PDA cell lines (AGS, MKN-45, SNU-1) and GSRC cell lines (NUGC-4, SNU-668, KATO-III). (I) Log-Rank tests demonstrated that higher GPER expression levels were associated with poorer prognoses in gastric carcinoma (P =4.6e-05), particularly diffuse-type gastric carcinoma with GSRC (P = 0.0032).
Fig. 2
Fig. 2
GSRC progression is regulated by estrogen. (A-C) Following treatment with 0, 20, and 40 nM E2 for 24 hours in KATO-III and SNU-668 cell lines, Western blotting(A) and qRT-PCR (B and C) experiments were performed to quatify GPER protein and mRNA expression levels. (D-E) Following treatment with 0, 20, and 40 nM E2 in KATO-III (D) and SNU-668 (E), cell viabilities were evaluated using the CCK8 assays at specific time intervals (0, 24, 48, and 72 hours). (F-G) EdU assays were used to assess cell proliferation abilities in KATO-III (F) and SNU-668 (G) after treatment with 0, 20, and 40 nM E2 for 24 hours (scale represented 100 μm). (H-I) Invasion and migration abilities of KATO-III (H) and SNU-668 (I) were assessed using transwell assays after treatment with 0, 20, and 40 nM E2 for 24 hours. (J-K) Flow cytometry analyses were used to assess apoptosis rates in KATO-III (J) and SNU-668 (K) after treatment with 0, 20, and 40 nM E2 for 24 hours. (L) A xenograft model was established in BALB/c nude mice with SNU-668, with E2-treated (n = 5) and control (n = 5) groups. After sacrificing the mice, the representive tumors were photographed, and tumor weights and growth curves were measured. Data were presented as mean ± SEM. *P < 0.05, **P < 0.01, ***P < 0.001.
Fig. 3
Fig. 3
Pharmaceutical targeting of GPER regulates GSRC progression. (A-D) Following treatment with 0, 50, and 100 nM G-1 and 0, 0.5, and 1 μM G-15 for 24 hours in SNU-668, Western blotting(A-B) and qRT-PCR (C-D) experiments were performed to quatify GPER mRNA and protein expression levels. (E-F) Following treatment with 0, 50, and 100 nM G-1 (E) and 0, 0.5, and 1 μM G-15 for 24 hours in SNU-668, cell viabilities were evaluated at specific time intervals (0, 24, 48, and 72 hours) using the CCK8 assays. (G-H) EdU assays were used to assess cell proliferation abilities in SNU-668 after treatment with 0, 50, and 100 nM G-1 (G) and 0, 0.5, and 1 μM G-15 (H) for 24 hours (scale represented 100 μm). (I-J) Invasion and migration abilities of SNU-668 were assessed using transwell assays after treatment with 0, 50, and 100 nM G-1 (I) and 0, 0.5, and 1 μM G-15 (J). (K-L) Flow cytometry analyses were used to assess apoptosis rates in SNU-668 after treatment with 0, 50, and 100 nM G-1 (K) and 0, 0.5, and 1 μM G-15 (L) for 24 hours. (M-N) A xenograft model was established in BALB/c nude mice with SNU-668, with G-1-treated (n = 5) and control groups (n = 5) (M), and G-15-treated (n = 5) and control (n = 5) groups (N). After sacrificing the mice, the representive tumors were photographed, and tumor weights and growth curves were measured. (O) A tail vein lung metastasis model in nude mice using the SNU-668 was established, with G-15-treated (n = 2) and control (n = 2) groups. Lung metastatic nodules were quantified, and H&E staining experiments were conducted. (P) The diagram of the experimental scheme for the mini-PDX model. (Q) Comparisons of tumor/control (T/C) ratios for each group in the mini-PDX model. Data were presented as means ± SEM. *P < 0.05, **P < 0.01, ***P < 0.001.
Fig. 4
Fig. 4
GPER expression regulates GSRC progression. (A-C.) Western blotting (A) and qRT-PCR (B-C) experiments were used to assess the knockdown efficiencies of KATO-III and SNU-668 transfected with shGPER. (D-E) CCK8 assays were used to evaluate the cell viabilities of KATO-III (D) and SNU-668 (E) after GPER silencing at specific time intervals (0, 24, 48, and 72 hours). (F-G) EdU assays were used to evaluate the cell proliferation abilities of KATO-III (F) and SNU-668 (G) after GPER silencing (scale represented 100 μm). H-I. Invasion and migration abilities of KATO-III (H) and SNU-668 (I) were assessed using transwell assays after GPER silencing. J-K. Flow cytometry analyses were used to assess apoptosis rates in KATO-III (J) and SNU-668 (K) cells after GPER silencing. (L) Xenografts were established using BALB/c nude mice with SNU-668 transfected with shGPER (n = 5) and shControl (n = 5). After sacrificing the mice, the representive tumors were photographed, and tumor weights and growth curves were measured. Data were presented as means ± SEM. ***P < 0.001.
Fig. 5
Fig. 5
GPER is involved in regulation the Hippo signaling pathway, facilitating GSRC progression by inducing YAP phosphorylation and nuclear translocation. (A) Following GPER silencing in SNU-668, the top 20 significantly enriched KEGG functional pathways were identified, including Hippo signaling pathway. (B) GSEA analysis indicated that, after GPER silencing in SNU-668, the expression of YAP target gene signatures was downregulated. (C) The volcano plot of differentially expressed genes showing red dots for upregulated genes (2403) and blue dots for downregulated genes (2138) (P < 0.05, fold change > 1.5). (D) The heatmap illustrated that expression levels of YAP target genes commonly decreased following GPER silencing. (E) Western blotting experiments were performed to determine the YAP and phosphorylated YAP levels in KATO-III and SNU-668 after E2 treatment. (F-G) CYR61 and CTGF mRNA expression levels in KATO-III (F) and SNU-668 (G) were assessed by qRT-PCR following GPER silencing after E2 treatment. (H) Western blotting experiments were performed to determine the YAP and phosphorylated YAP levels in KATO-III and SNU-668 after G-1 treatment. (I-J) CYR61 and CTGF mRNA expression levels in KATO-III (I) and SNU-668 (J) were assessed by qRT-PCR following GPER silencing after G-1 treatment. (K) Western blotting experiments were performed to determine the YAP and phosphorylated YAP levels in KATO-III and SNU-668 after GPER silencing. (L-M) CYR61 and CTGF mRNA expression levels in KATO-III (L) and SNU-668 (M) were assessed by qRT-PCR following GPER silencing. (N) Western blotting experiments were performed to determine the YAP and phosphorylated YAP levels in KATO-III and SNU-668 after G-15 treatment. (O-P) CYR61 and CTGF mRNA expression levels in KATO-III (O) and SNU-668 (P) were assessed by qRT-PCR after G-15 treatment. (Q-R) Western blotting experiments were performed to determine the nuclear and cytoplasmic distribution of YAP after G-1 (Q) and G-15 treatments (R). (S-V) Immunofluorescence staining experiments were used to evaluate YAP nuclear localizations after G-1 (S-T) and G-15 (U-V) treatments. Specific antibodies and DAPI were used to stain YAP (green) and nuclei (blue). Data were presented as means ± SEM. **P < 0.01, ***P < 0.001.
Fig. 6
Fig. 6
GPER facilitates the progression of GSRC through modulation of the Hippo/YAP axis. (A) Western blotting experiments were used to evaluate the efficiency of Flag-YAP overexpression in SNU-668 with GPER silencing. (B) QRT-PCR experiments were performed to quantify CYR61 and CTGF mRNA expression levels following Flag-YAP overexpression in SNU-668 with GPER silencing. (C) CCK-8 assays were used to evaluate the cell viabilities following Flag-YAP overexpression in SNU-668 with GPER silencing at specific time intervals (0, 24, 48, and 72 hours). (D) EdU assays were used to evaluate the cell proliferation abilities following Flag-YAP overexpression in SNU-668 with GPER silencing (scale represented 100 μm). (E) Cell invasion and migration abilities following Flag-YAP overexpression were assessed using transwell assays in SNU-668 with GPER silencing.(F) Flow cytometry analyses were used to assess cell apoptosis rates following Flag-YAP overexpression in SNU-668 with GPER silencing. (G) The xenograft model was constructed using SNU-668 stably transfected with shControl (n = 5), shGPER (n = 5), and shGPER+YAP (n = 5) groups. After sacrificing the mice, the representive tumors were photographed, and tumor weights and growth curves were measured. (H) The tail vein lung metastasis model was established, with shControl (n = 2), shGPER (n = 2), and shGPER+YAP (n = 2) groups. Lung metastatic nodules were quantified, and H&E staining experiments were conducted. Data were presented as mean ± SEM. **P < 0.01, ***P < 0.001.
Fig. 7
Fig. 7
GPER modulates LATS1 and YAP phosphorylation through competitive binding with ARRB2. (A-B) Molecular docking of GPER and ARRB2 (A) and predicted binding sites (B). (C) The binding between GPER and ARRB2 was examined by co-IP experiments following mutations of the predicted binding sites. (D) The binding between GPER and ARRB2 was examined by Co-IP experiments following overexpression of Flag-GPER and Myc-ARRB2 in HEK-293T cells. (E) The binding between GPER and ARRB2 was examined by Co-IP experiments following overexpression of Flag-LATS1 and Myc-ARRB2 in HEK-293T cells. (F-I) Interactions between GPER and ARRB2 (F-G), as well as LATS1 and ARRB2 (H-I) were determined with Co-IP experiments. (J) Depletion of ARRB2 in SNU-668 reversed the increased phosphorylation levels of LATS1 and YAP induced by G-15 treatment. After treating SNU-668 transfected with siNC and siARRB2 with 0 and 0.5 μM G-15, Western blotting was performed to detect the protein levels of LATS1, YAP, p-LATS1, and p-YAP (S127). (K-N) Co-IP experiments were conducted to evaluate the binding of ARRB2 with LATS1 and YAP after treatment with E2 (K), G-1 (L), or following GPER silencing (M), or G-15 treatment (N). (O) Interactions of ARRB2 with LATS1 and YAP following G-15 treatment with ARRB2 silencing were detected with Co-IP experiments.
Fig. 8
Fig. 8
Involvement of the Hippo/YAP pathway and the GPER in a positive feedback regulation loop. (A) ChIP-seq data analysis of YAP binding to the GPER promoter region (data from GEO, accession number GSE61852). (B) GPER genome schematic diagram. (C-D) A ChIP assay was performed using a YAP antibody to verify its binding to the GPER promoter region. The enriched DNA was analyzed by agarose gel electrophoresis (C) and qRT-PCR (D), with IgG used as a negative control. (E-H) After YAP silencing in KATO-III and SNU-668, the GPER protein level was reduced (E-F) and CYR61 and GPER mRNA expression levels were downregulated (G-H). (I-L) After Verteporfin (VP) treatment of KATO-III and SNU-668, Western blotting detected a concentration-dependent decrease in GPER protein levels (I-J), and qRT-PCR experiments revealed similar trends for CYR61 and GPER mRNA expression levels (K-L). (M-P) Immunofluorescence staining experiments exhibited that GPER expression in the cell membrane was downregulated after YAP silencing (M-N) and treatment with VP (10 μM) for 24 hours (O-P) in KATO-III and SNU-668. Specific antibodies and DAPI were used to stain GPER (red) and nuclei (blue). Data were presented as mean ± SEM. ***P < 0.001.

Similar articles

References

    1. Taghavi S., Jayarajan S.N., Davey A., Willis A.I. Prognostic significance of signet ring gastric cancer. J. Clin. Oncol. 2012;30:3493–3498. - PMC - PubMed
    1. Mariette C., Carneiro F., Grabsch H.I., van der Post R.S., Allum W., de Manzoni G. Consensus on the pathological definition and classification of poorly cohesive gastric carcinoma. Gastric Cancer. 2019;22:1–9. - PubMed
    1. Kwon K.J., Shim K.N., Song E.M., Choi J.Y., Kim S.E., Jung H.K., et al. Clinicopathological characteristics and prognosis of signet ring cell carcinoma of the stomach. Gastric Cancer. 2014;17:43–53. - PubMed
    1. Li Y., Ma F.H., Xue L-Y, Tian Y.T. Neoadjuvant chemotherapy vs upfront surgery for gastric signet ring cell carcinoma: a retrospective, propensity score-matched study. World J. Gastroenterol. 2020;26:818–827. - PMC - PubMed
    1. Pernot S., Voron T., Perkins G., Lagorce-Pages C., Berger A., Taieb J. Signet-ring cell carcinoma of the stomach: impact on prognosis and specific therapeutic challenge. World J. Gastroenterol. 2015;21:11428–11438. - PMC - PubMed

Publication types

MeSH terms