. 2025 Jul 21;5(7):101085.
doi: 10.1016/j.crmeth.2025.101085. Epub 2025 Jun 23.

Characterization of human CMV-specific CD8+ T cells using multi-layer single-cell omics

Affiliations

Characterization of human CMV-specific CD8+ T cells using multi-layer single-cell omics

Ioanna Gemünd et al. Cell Rep Methods. .

Abstract

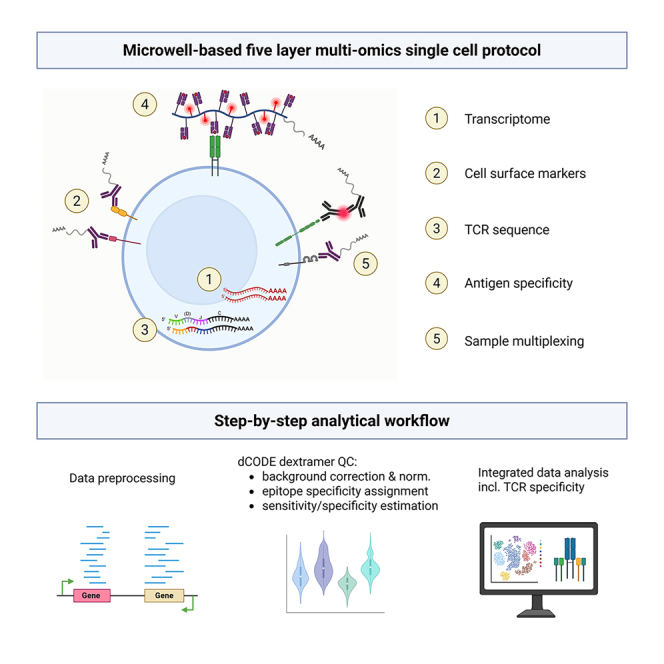
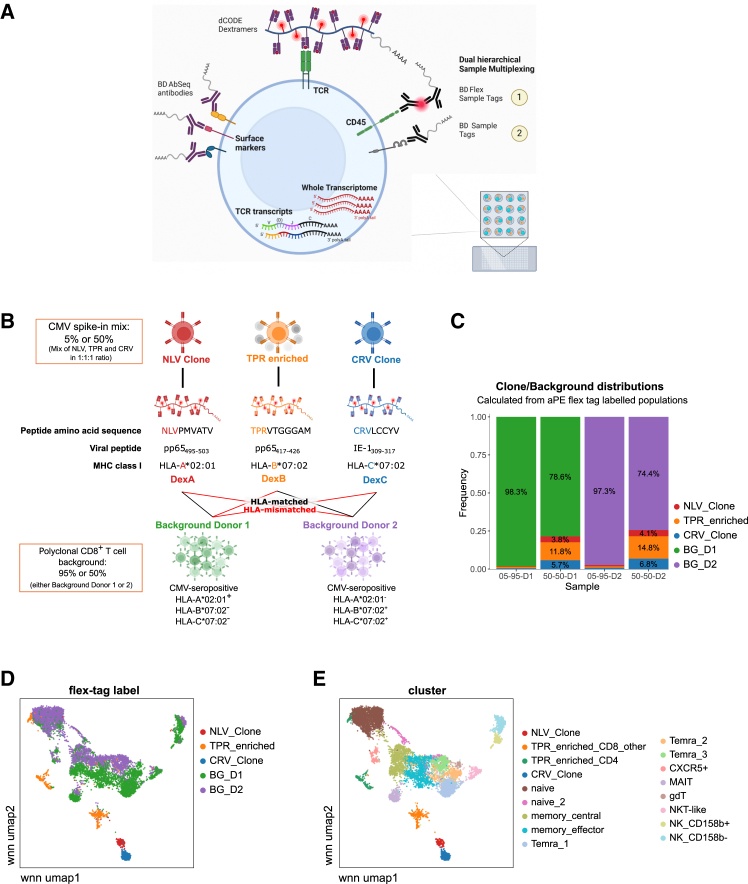
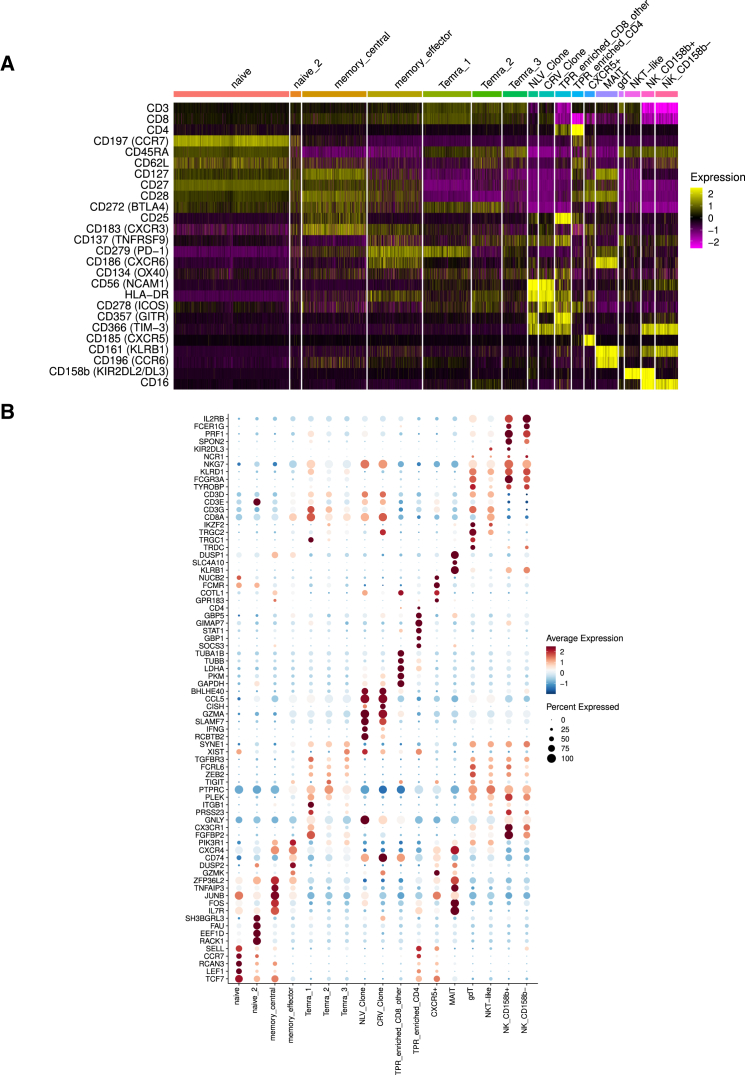
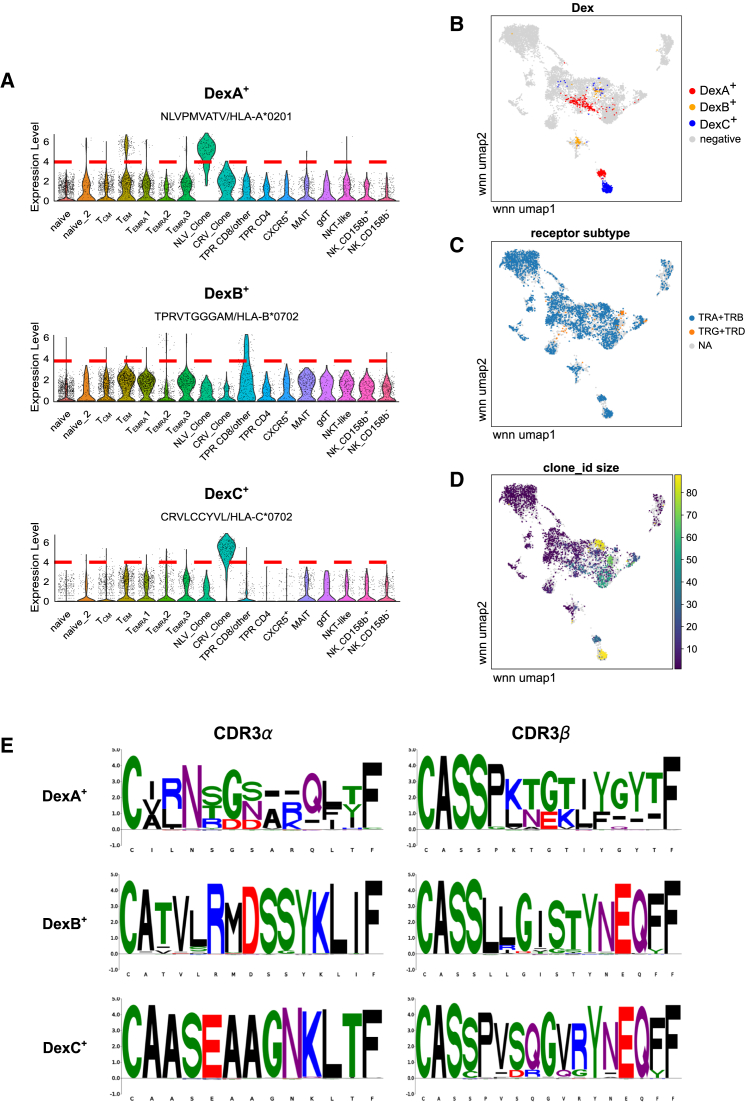
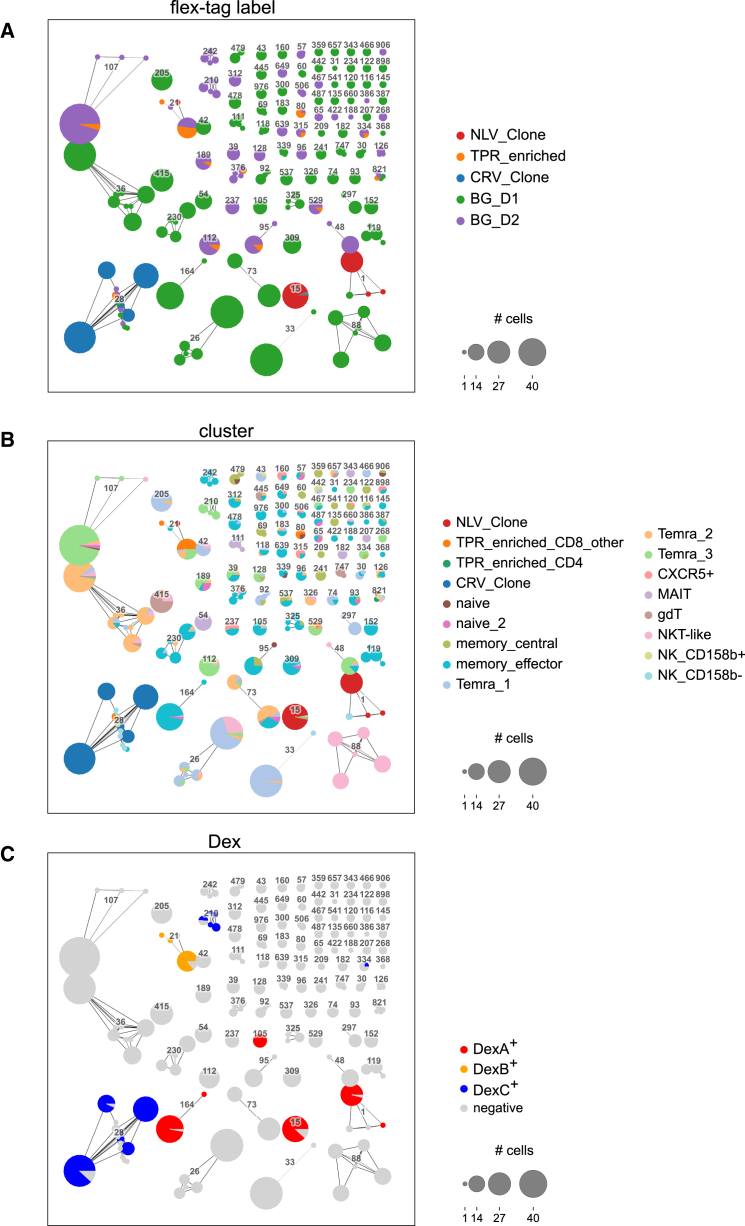
In this study, we established a comprehensive workflow to collect multi-omics single-cell data using a commercially available micro-well-based platform. This included whole transcriptome, cell surface markers (targeted sequencing-based cell surface proteomics), T cell specificities, adaptive immune receptor repertoire (AIRR) profiles, and sample multiplexing. With this technique, we identified paired T cell receptor sequences for three prominent human CMV epitopes. In addition, we assessed the ability of dCODE dextramers to detect antigen-specific T cells at low frequencies by estimating sensitivities and specificities when used as reagents for single-cell multi-omics.

Keywords: BD Rhapsody; CD8(+) T cells; CMV; CP: immunology; TCR sequencing; antigen-specific T cells; dCODE dextramers; single-cell multi-omics; systems immunology.


Conflict of interest statement

Declaration of interests The authors declare no competing interests.

Figures

None
Graphical abstract
Figure 1
Figure 1
Single-cell multi-omics workflow allows delineation of spike-in and background samples (A) Scheme of the different multi-omic modalities captured per cell. (B) Schematic of the spike-in versus background experiment. The types of input material are depicted, and for the three CMV spike-in samples at the top, the corresponding CMV epitope as well as dCODE dextramer specificity are indicated by black lines. For polyclonal background samples, HLA-matched and -mismatched combinations with the dCODE dextramers are shown. HLA-matched and -mismatched combinations with dCODE dextramers are depicted by black and red lines, respectively. (C) Distribution of spike-in and background cells in the four dCODE dextramer staining conditions. (D and E) wnnUMAP representation of single-cell data with coloring according to flex-tag label (origin of five input populations) (D) and Leiden clustering (E). See also Figures S1 and S2 and Table S1.
Figure 2
Figure 2
Cell cluster characterization by surface protein and marker gene expression (A) Expression heatmap of 31 surface markers by cluster (colored by z-transformed expression). (B) Dot plot displaying expression of the top five markers for each cluster, as well as additional selected T cell and NK cell gene markers. Dots are colored by z-transformed mean expression per cluster, dot size represents the frequency of expression within the cluster. See also Figure S2.
Figure 3
Figure 3
Characterization of CMV-specific CD8+ T cells (A) Distribution of background noise-corrected CLR-normalized DexA, DexB, and DexC counts per cluster. Red line indicates cutoff for Dex+ label. (B–D) wnnUMAP representation of dataset with highlighted DexA+, DexB+, and DexC+ cells (B), colored by receptor type after filtering for “single pair,” “extra VJ,” and “extra VDJ” sequences (C) and showing the corresponding clone size for each cellular TCR sequence (D). (E) CDR3 sequence logo plots depicting under- and overrepresented amino acids of TCR CDR3α and CDR3β amino acid sequences. Logo plots are shown for DexA+, DexB+, and DexC+ cells. Colors indicate amino acid chemistry. See also Figures S3 and S4 and Tables S2, S3, and S4.
Figure 4
Figure 4
TCR repertoires of CMV-specific CD8+ T cells (A–C) Clonotype network graphs for filtered TCR sequences are colored by flex-tag label (A), annotated cluster from scRNA-seq analysis (B), and dextramer label (C). Each circle depicts a clonotype. Connecting lines between clones indicate a “clonotype cluster,” thus a high degree of CDR3 amino acid similarity between the VJ and VDJ chains of the connected clones. The numeric label indicates the clonotype cluster number. Clonotype clusters in the graph layout are arranged according to their size. See also Tables S3 and S4.

Similar articles

References

    1. Rajewsky N., Almouzni G., Gorski S.A., Aerts S., Amit I., Bertero M.G., Bock C., Bredenoord A.L., Cavalli G., Chiocca S., et al. LifeTime and improving European healthcare through cell-based interceptive medicine. Nature. 2020;587:377–386. doi: 10.1038/s41586-020-2715-9. - DOI - PMC - PubMed
    1. Baysoy A., Bai Z., Satija R., Fan R. The technological landscape and applications of single-cell multi-omics. Nat. Rev. Mol. Cell Biol. 2023;24:695–713. doi: 10.1038/s41580-023-00615-w. - DOI - PMC - PubMed
    1. Efremova M., Vento-Tormo R., Park J.-E., Teichmann S.A., James K.R. Immunology in the Era of Single-Cell Technologies. Annu. Rev. Immunol. 2020;38:727–757. doi: 10.1146/annurev-immunol-090419-020340. - DOI - PubMed
    1. Valkiers S., de Vrij N., Gielis S., Verbandt S., Ogunjimi B., Laukens K., Meysman P. Recent advances in T-cell receptor repertoire analysis: bridging the gap with multimodal single-cell RNA sequencing. ImmunoInformatics. 2022;5 doi: 10.1016/j.immuno.2022.100009. - DOI
    1. Hoehn K.B., Kleinstein S.H. B cell phylogenetics in the single cell era. Trends Immunol. 2024;45:62–74. doi: 10.1016/j.it.2023.11.004. - DOI - PMC - PubMed

MeSH terms

Substances

LinkOut - more resources