. 2025 Jul 30;45(31):e1658242025.
doi: 10.1523/JNEUROSCI.1658-24.2025.

ALS Mutations Shift the Isoelectric Point of the KIF5A C Terminal Inducing Protein Aggregation and TDP-43 Mislocalization

Affiliations

ALS Mutations Shift the Isoelectric Point of the KIF5A C Terminal Inducing Protein Aggregation and TDP-43 Mislocalization

Pietro Zanella et al. J Neurosci. .

Abstract

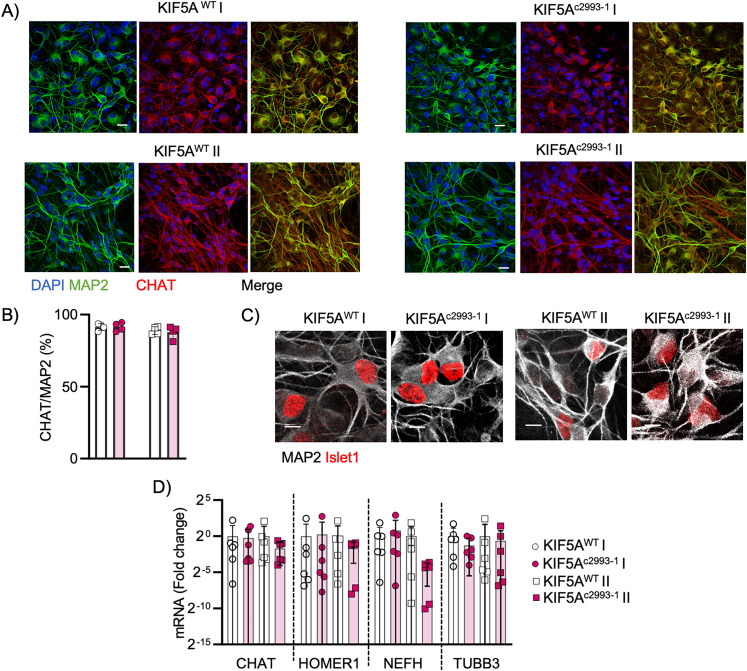
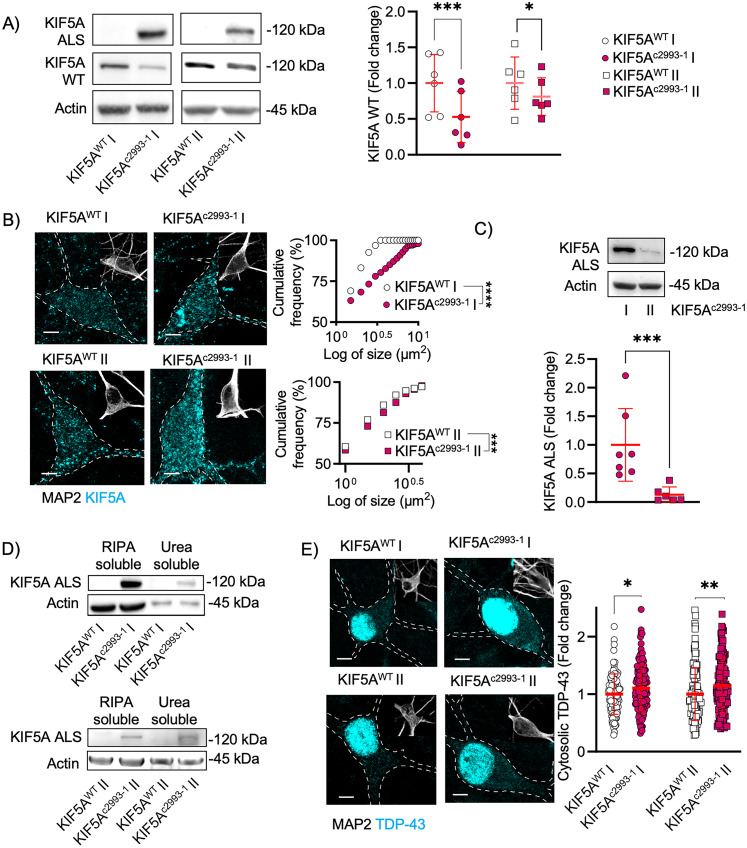
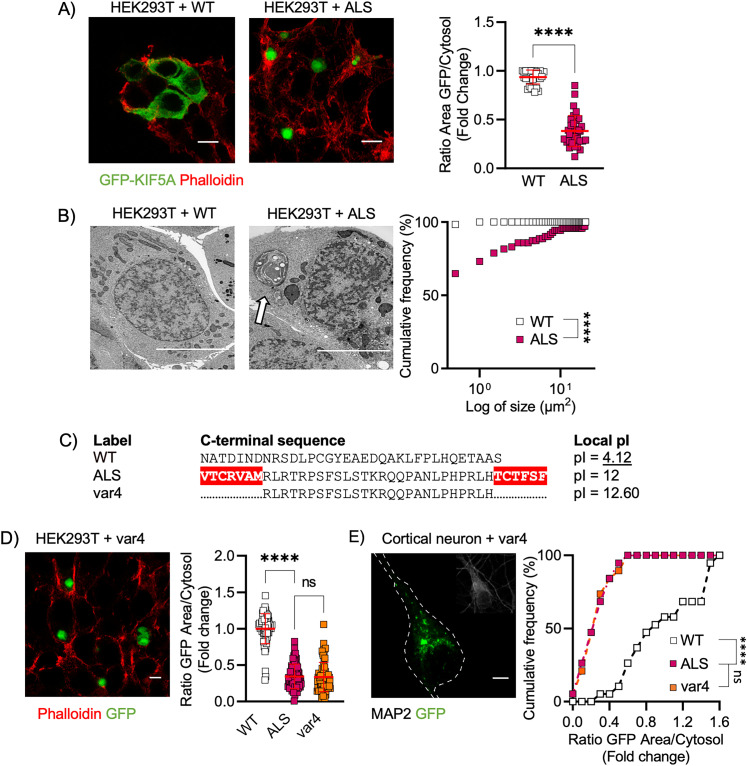
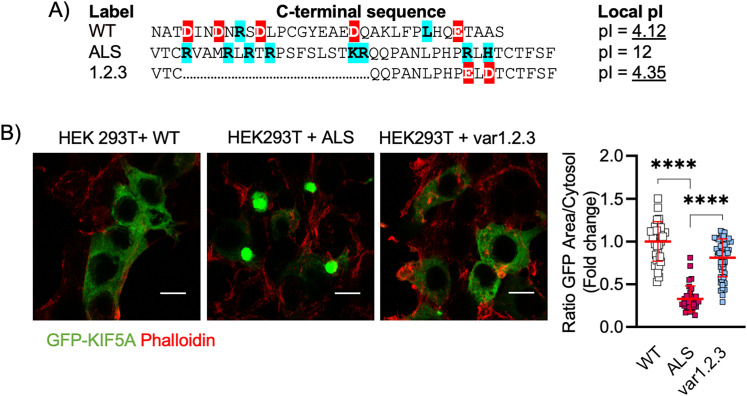
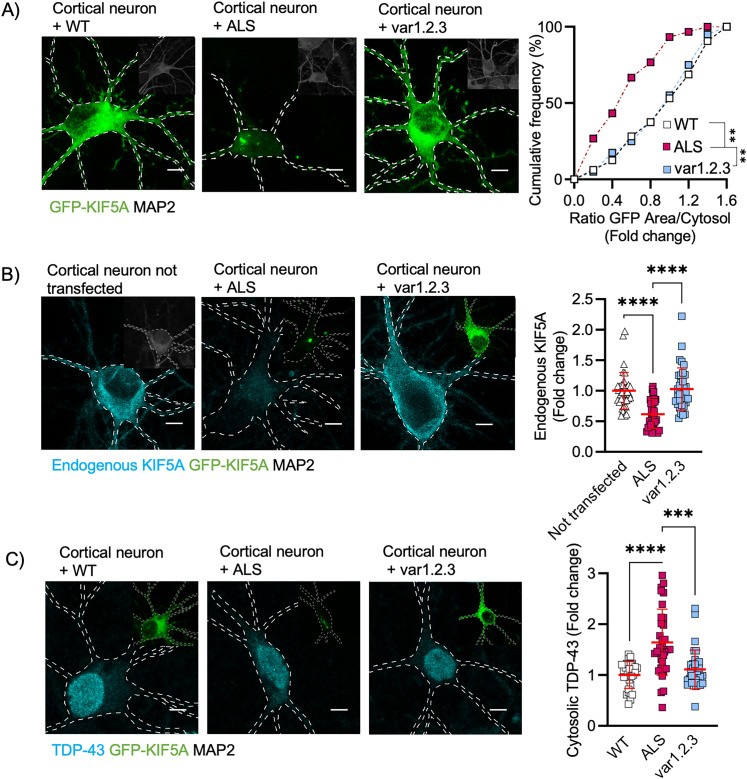
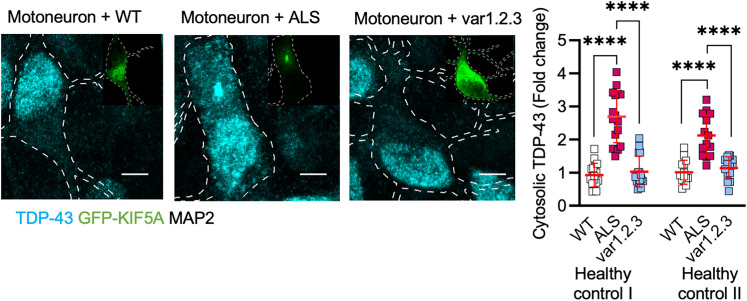
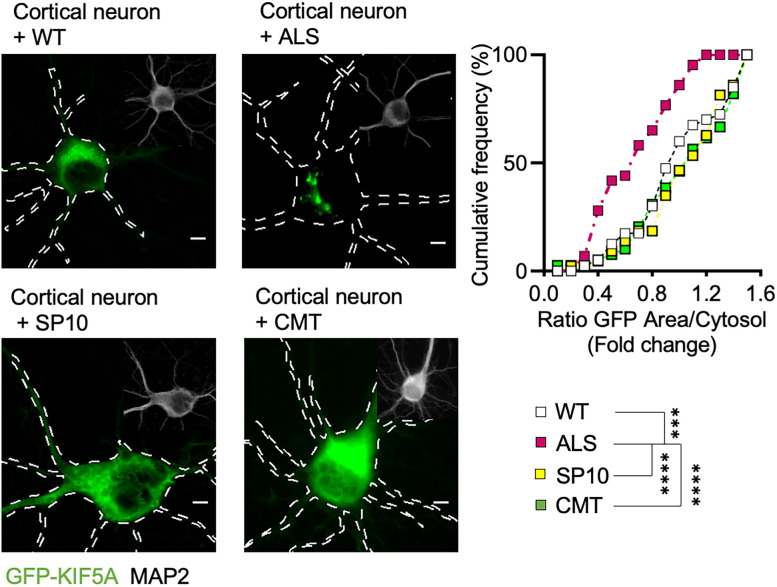
Amyotrophic lateral sclerosis (ALS) is a devastating neurodegenerative disease characterized by death of lower and upper motor neurons. Although the mechanism behind the selective neuron loss is still unclear, several heterogeneous genes have been causally linked to ALS. KIF5A encodes for a neuronally enriched kinesin involved in protein transport, and mutations within this gene have been causally linked to different motor neuron diseases. The mutations identified in ALS patients are mostly predicted to alter its mRNA splicing, leading to a frameshift mutation and an aberrant 39-aa-long sequence in the C-terminal domain of KIF5A. Here we found that ALS-related KIF5A mutations induce the accumulation of the mutant form of the protein in human motoneurons, which are also characterized by the cytosolic mislocalization of TDP-43. This ALS hallmark was even exacerbated upon overexpression of the ALS-KIF5A protein in cells differentiated from healthy controls and primary neurons, suggesting a pathological connection between the cellular load of the mutant protein and TDP-43 pathology. While the terminal domain of the WT isoform is characterized by an acid isoelectric point (pI), the ALS variant presents a basic pI due to the altered aminoacidic composition of this sequence. We thus generated a KIF5A-ALS isoform that retained part of the aberrant sequence but with lower pI. The overexpression of this mutated variant led to significantly lower protein aggregation and TDP-43 mislocalization than the ALS mutant. Our data show that re-establishing the correct pI rescues KIFA aggregation and significantly reduces the cytoplasmic mislocalization of TDP-43.

Keywords: ALS; KIF5A; TDP-43; aggregation; isoelectric point.


Conflict of interest statement

The authors declare no competing financial interests.

Figures

Figure 1.
Figure 1.
The KIF5Ac2993-1 mutation does not affect the differentiation of hiPSC into MNs. A, Representative images of hiPSC-derived neurons at DIV 21 (scale bar, 10 µm). In blue, DAPI; in green, MAP2; and in red, CHAT. B, Most of motoneurons in the cultures were CHAT positive. N = 4 independent differentiations. Data plotted as mean ± SD, mean of KIF5AWT I = 92%, KIF5Ac2993-1 I = 91%, KIF5AWT II = 89%, and KIF5Ac2993-1 II = 88%. C, Representative immunofluorescence images of hiPSC-derived motoneuron cultures at DIV 21 (scale bar, 10 µm) expressing Islet1 (in red). D, All cell lines expressed cholinergic neuronal marker CHAT, synaptic marker Homer1, and neuronal markers Neurofilament heavy (NEFH) and Tubulin β-3 (TUBB3). N = 6 independent differentiation. Data plotted as mean ± SD and analyzed with two-way ANOVA.
Figure 2.
Figure 2.
TDP-43 is mislocalized in hiPSC-derived motoneurons from ALS cell lines. A, Representative immunoblots of hiPSC-derived neurons at DIV 63 showed a significant reduction of the WT isoform of KIF5A in the ALS cell lines. N = 6 independent differentiations. Data plotted as mean ± SD and compared by paired t test one-tailed. For KIF5Ac2993-1 I versus KIF5AWT I: ***p = 0.0007, mean of differences = −0.4732; for KIF5Ac2993-1 II versus KIF5AWT II: *p = 0.0352, mean of differences = −0.1885. B, Representative immunofluorescence images of hiPSC-derived neurons (DIV 63; scale bar, 5 µm). ALS motoneurons displayed significantly larger KIF5A structures compared with their isogenic controls. Data from two independent differentiation plotted as cumulative frequency distributions (number of bins = 27; median of KIF5AWT I = 1.285, mean of KIF5Ac2993-1 I = 1.285, median of KIF5AWT II = 1.028 and median of KIF5Ac2993-1 II = 1.208) and analyzed with Kolmogorov–Smirnov, two-tailed. For KIF5Ac2993-1 I versus KIF5AWT I: ****p < 0.0001; for KIF5Ac2993-1 II versus KIF5AWT II: ***p = 0.0006. C, Representative immunoblot of the pathological KIF5A isoform in ALS motoneurons (DIV 63). KIF5Ac2993-1 II showed an 87% reduction of KIF5A-ALS expression compared with KIF5Ac2993-1 I. N = 7 (KIF5Ac2993-1 I) and 6 (KIF5Ac2993-1 II) independent differentiations. Data plotted as mean ± SD; and compared with Mann–Whitney test, one-tailed. KIF5Ac2993-1 II versus KIF5Ac2993-1 I: ***p = 0.00006; differences between medians = −0.7535. D, RIPA-insoluble fractions of cell lysates from mutant cultures contain the pathological isoform of KIF5A. E, Representative immunofluorescence images of hiPSC-derived neurons (DIV 63; scale bar, 5 µm). Immunofluorescence analysis revealed TDP-43 (in cyan) cytosolic enrichment in ALS cell lines. N = 110 (KIF5AWT I), 129 (KIF5Ac2993-1 I), 125 (KIF5AWT II), and 134 (KIF5Ac2993-1 II) neurons from six independent differentiations. Data plotted as mean ± SD and compared with Mann–Whitney test, two-tailed. For KIF5Ac2993-1 I versus KIF5AWT I: *p = 0.0461; difference between medians = 0.0521; for KIF5Ac2993-1 II versus KIF5AWT II: ***p = 0.0056; difference between medians = 0.2160.
Figure 3.
Figure 3.
KIF5A-ALS aggregation in HEK depends on aberrant Cterm sequence's pI. A, Representative immunofluorescence images of transfected HEKs (scale bar, 10 µm). The overexpression of the KIF5A-ALS construct led to protein aggregation. N = 32 (WT) and 36 (ALS) cells from three independent cellular preparations. Data plotted as mean ± SD and compared with Mann–Whitney test, two-tailed. ****p < 0.0001; difference between medians = 0.62. B, Representative TEM images showed larger aggresomes in HEKs transfected with KIF5A-ALS construct (scale bar, 5 µm). Data from three independent cellular preparations plotted as cumulative frequency distributions (number of bins = 42, median of WT = 0.113, and median of ALS = 0.423) and analyzed with Kolmogorov–Smirnov, two-tailed, ****p < 0.0001. C, Terminal aminoacidic sequences of the KIF5A WT, ALS and var4 constructs. The two aggregation-prone sequences identified by Aggrescan in the ALS sequence are highlighted in red. D, Representative images of HEK (scale bar, 5 µm) transfected with KIF5A var4. Eliminating the two aggregation-prone sequences did not ameliorate protein aggregation. N = 66 (WT), 69 (ALS) and 68 (var4) cells from three independent cellular preparations. Data plotted as mean ± SD and analyzed with Kruskal–Wallis test followed by Dunn's multiple-comparison test to confront each condition to var4. For var4 versus WT: ****p < 0.0001, mean rank difference = 98.89; for var4 versus ALS: p > 0.999, mean rank difference = 4.488. E, Representative image of primary cortical neurons (DIV 8; scale bar, 5 µm) transfected with KIF5A var4. As shown in HEKs, KIF5A var4 led to protein aggregation. Data from three independent cell preparation plotted as cumulative distributions (number of bins = 17, median of WT = 0.875, mean of ALS = 0.272, mean of var4 = 0.255) and analyzed with Kruskal–Wallis test, two-tailed, followed by Dunn's multiple-comparison test to confront each condition to var4. For var4 versus WT: ****p < 0.0001, mean rank difference = −27.21; for var4 versus ALS: p > 0.999, mean rank difference = −0.105.
Figure 4.
Figure 4.
The pI of its C terminal contributes to KIF5A aggregation. A, Aminoacidic sequences of KIF5A isoforms and their respective pI. Basic amino acids are labeled in blue while the acid ones in red. B, Representative images of transfected HEKs. The variant 1.2.3 showed to have a homogenous cytosolic distribution similar to WT. N = 32 (WT), 32 (ALS), and 51 (var1.2.3) cells from three independent cellular preparations. Data plotted as mean ± SD and analyzed with Kruskal–Wallis test, two-tailed, followed by Dunn's multiple-comparison test to confront each condition with ALS. For ALS versus WT: ****p < 0.0001, mean rank difference = −168.2; for ALS versus var1.2.3: ****p < 0.0001, mean rank difference = −136.
Figure 5.
Figure 5.
Restoring the original pI ameliorates TDP-43 mislocalization and endogenous KIF5A in primary neurons. A–C, Representative images of transfected primary cortical neurons (DIV 8; scale bar, 5 µm). A, KIF5A variant 1.2.3 showed lower aggregation behavior than ALS. Data from three independent cellular preparations plotted as cumulative frequency distributions (number of bins = 9, median of WT = 1.067, median of ALS = 0.55, and median of var1.2.3 = 1.048) and analyzed by Kruskal–Wallis test, two-tailed, followed by Dunn's multiple-comparison test to confront each condition to ALS. For ALS versus WT: **p = 0.001, mean rank difference = −41.74; for ALS versus var1.2.3: **p = 0.001, mean rank difference = −39.09. B, In cyan, staining for endogenous KIF5A. Overexpression of KIF5A-ALS led to lower levels of endogenous KIF5A compared with untransfected neurons and neurons overexpressing the variant 1.2.3. N = 36 (not transfected), 34 (ALS), and 35 (var1.2.3) primary cortical neurons from three independent cell preparations. Data plotted as mean ± SD and analyzed with Kruskal–Wallis test, two-tailed, followed by Dunn's multiple-comparison test to confront each condition to ALS. For ALS versus not transfected: ****p < 0.001, mean rank difference = −36.75; for ALS versus var1.2.3: ****p < 0.0001, mean rank difference = −37.20. C, In cyan, staining for TDP-43. KIF5A-ALS overexpression led to higher cytosolic TDP-43 compared with WT and var1.2.3 overexpression. N = 31 (WT), 32 (ALS), and 33 (var1.2.3), 29 (var1), and 24 (var1.2) primary cortical neurons from three independent cellular preparations. Data plotted as mean ± SD and analyzed with Kruskal–Wallis test, two-tailed, followed by Dunn's multiple-comparison test to confront each condition to ALS. For ALS versus WT: ****p < 0.0001, mean rank difference = 49.67; for ALS versus var1.2.3: ***p = 0.0003, mean rank difference = 42.58; for ALS versus var1: p > 0.999, mean rank difference = 19.70 and for ALS versus var1.2: p > 0.999, mean rank difference = 28.88.
Figure 6.
Figure 6.
KIF5A-ALS overexpression in control motoneurons resulted in TDP-43 mislocalization and sequestration in KIF5A aggregates. In cyan, TDP-43 in transfected healthy control motoneurons (DIV 21; scale bar, 5 µm). KIF5A-ALS overexpression led to cytosolic mislocalization and aggregation of TDP-43. For Healthy control I: N = 16 (WT), 17 (ALS), and 16 (var1.2.3) neurons from three independent differentiations. Data plotted as mean ± SD and analyzed with Kruskal–Wallis test, two-tailed, followed by Dunn's multiple-comparison test to confront each condition to ALS. For ALS versus WT: ****p < 0.0001, mean rank difference = 36.43; For ALS versus var1.2.3: ****p < 0.0001, mean rank difference = 34.06. For Healthy control II: N = 14 (WT), 14 (ALS), and 14 (var1.2.3) neurons from three independent differentiations. Data plotted as mean ± SD and analyzed with one-way ANOVA, two-tailed, followed by Dunnett's multiple-comparison test to confront each condition to ALS. For ALS versus WT: ****p < 0.0001, mean difference = 1.107; for ALS versus var1.2.3: ****p < 0.0001, mean difference = 0.98.
Figure 7.
Figure 7.
Mutations linked to SP10 and CMT do not induce KIF5A aggregation. Representative images of primary cortical neurons transfected with KIF5A isoforms (DIV 8; scale bar, 5 µm). Overexpression of CMT and SP10 constructs did not lead to protein aggregation. Data from three independent cell preparation plotted as cumulative distributions (number of bins = 16, median of WT = 0.96, median of ALS = 0.675, median of SP10 = 1.156, and mean of CMT = 1.082) and analyzed with Kruskal–Wallis test, two-tailed, followed by Dunn's multiple-comparison test to confront each condition to ALS. For ALS versus WT: ***p = 0.0004, mean rank difference = 40.22; for ALS versus SP10: ****p < 0.0001, mean rank difference = −49.67; for ALS versus CMT: ****p < 0.0001, mean rank difference = 49.80.

Similar articles

References

    1. Aasen T, et al. (2008) Efficient and rapid generation of induced pluripotent stem cells from human keratinocytes. Nat Biotechnol 26:1276–1284. 10.1038/nbt.1503 - DOI - PubMed
    1. Aizawa H, Sekine Y, Takemura R, Zhang Z, Nangaku M, Hirokawa N (1992) Kinesin family in murine central nervous system. J Cell Biol 119:1287–1296. 10.1083/jcb.119.5.1287 - DOI - PMC - PubMed
    1. Amador-Ortiz C, Lin W-L, Ahmed Z, Personett D, Davies P, Duara R, Graff-Radford NR, Hutton ML, Dickson DW (2007) TDP-43 immunoreactivity in hippocampal sclerosis and Alzheimer’s disease. Ann Neurol 61:435–445. 10.1002/ana.21154 - DOI - PMC - PubMed
    1. Arai T, et al. (2006) TDP-43 is a component of ubiquitin-positive tau-negative inclusions in frontotemporal lobar degeneration and amyotrophic lateral sclerosis. Biochem Biophys Res Commun 351:602–611. 10.1016/j.bbrc.2006.10.093 - DOI - PubMed
    1. Baron DM, et al. (2022) ALS-associated KIF5A mutations abolish autoinhibition resulting in a toxic gain of function. Cell Rep 39:110598. 10.1016/j.celrep.2022.110598 - DOI - PMC - PubMed

MeSH terms