. 2025 Jun 24;15(1):212.
doi: 10.1038/s41398-025-03431-2.

Predicting individual treatment response in alcohol use disorders: a reverse translational proof-of-concept study

Affiliations

Predicting individual treatment response in alcohol use disorders: a reverse translational proof-of-concept study

Sara De Carlo et al. Transl Psychiatry. .

Abstract

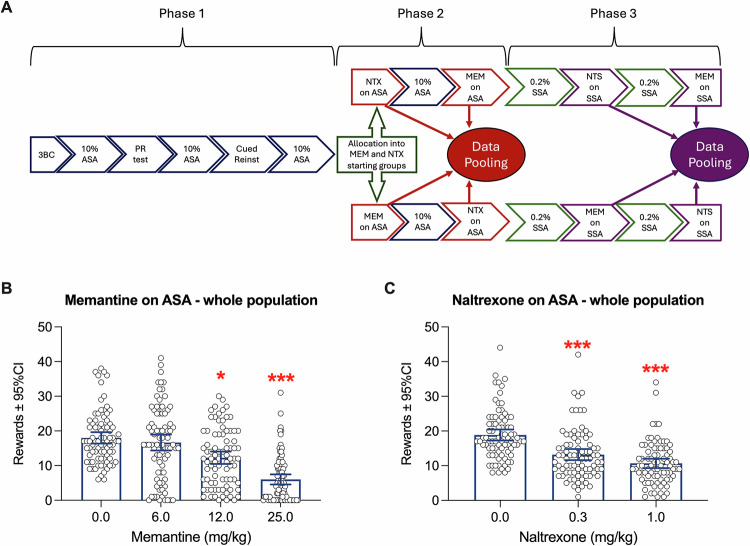
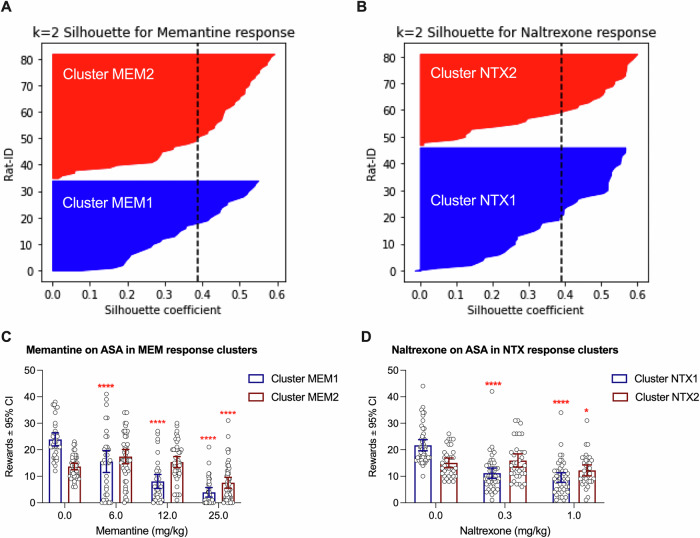
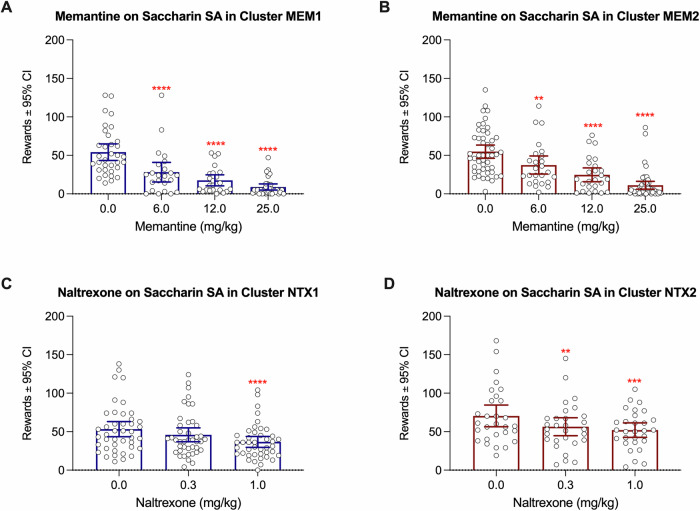
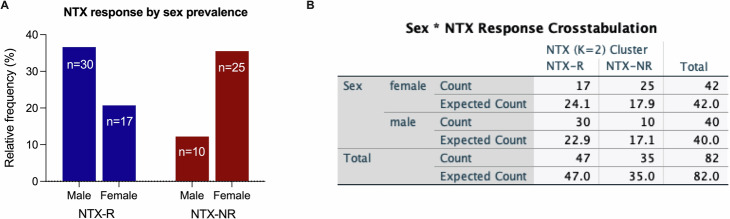
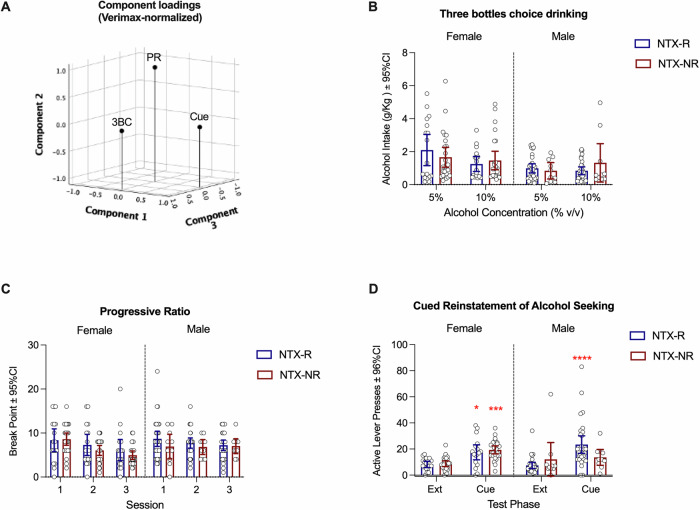
The development of medications for alcohol use disorders (AUD) faces stagnation, as promising drugs failed to translate in clinic. Screening on homogeneous groups of animals drugs later tested on heterogeneous clinical cohorts may contribute to the translational gap. We hypothesized that a preclinical model of AUD accounting for inter-individual heterogeneity would predict the lack of efficacy of a drug that failed clinical trials (Memantine) and the efficacy of an approved AUD medication (Naltrexone). Baseline alcohol drinking, motivation, and cued reinstatement were screened in NIH genetically heterogeneous-stock rats before testing the effect of Memantine and Naltrexone on alcohol (ASA) and saccharin self-administration (SSA). Based on the individual effect of Memantine and Naltrexone on ASA, rats were allocated into independent clusters of responders and non-responders to each drug. The same doses of Memantine reduced both ASA and SSA in both clusters, while Naltrexone selectively reduced ASA in responder rats. Naltrexone responders were in majority males, while non-responders were mostly females. Naltrexone responders and non-responders showed similar alcohol drinking and motivation, but non-responders did not show cued reinstatement of alcohol seeking. In line with clinical observations, in a model accounting for individual heterogeneity Memantine failed to selectively reduce ASA, the population could be unbiasedly clustered in responders and non-responders, and cued reactivity associated with Naltrexone response in males. These results advocate the use of inter-individual heterogeneity for preclinical prediction of drug efficacy in AUD before clinical trials. In addition, we observed sex differences in response to Naltrexone that can be back-translated in clinic.


Conflict of interest statement

Competing interests: The authors declare no competing interests.

Figures

Fig. 1
Fig. 1
A Schematic representation of experimental timeline. 3BC 3-bottle choice, ASA alcohol self-administration, PR progressive ratio, Cued Reinst cued reinstatement, MEM memantine, NTX naltrexone, SSA saccharin self-administration. B Effect of Memantine (n = 83) on alcohol self-administration at whole population level. The intermediate and highest dose of Memantine significantly reduced alcohol self-administration. Groups mean ± 95%CI: 0.0 mg/kg, 17.99 ± 1.65; 6 mg/kg, 16.64 ± 2.3; 12.0 mg/kg, 12.27 ± 1.81; 25.0 mg/kg, 6.024 ± 1.445. C Effect of Naltrexone (n = 82) on alcohol self-administration at whole population level. Both doses of Naltrexone significantly reduced alcohol self-administration. Groups mean ± 95%CI: 0.0 mg/kg, 18.87 ± 1.59; 0.3 mg/kg, 13.21 ± 1.61; 1.0 mg/kg, 10.67 ± 1.35. Bars represent the Mean ± 95%CI of number of rewards earned in a 30 min session. Statistical significance: *p < 0.05 and ***p < 0.001 vs vehicle.
Fig. 2
Fig. 2. Effect of Memantine and Naltrexone treatment on alcohol self-administration in clusters based on individual effect of the drugs on ASA.
A, B Silhouette plot of K = 2 clustering of individual response to A Memantine and B Naltrexone on alcohol self-administration. Horizontal bars represent individual silhouette coefficient, the vertical dashed line indicates the k = 2 cluster silhouette score. C Memantine reduced alcohol self-administration in cluster MEM1 (n = 35) at all doses tested and in cluster MEM2 (n = 48) only at the highest dose. Groups mean ± 95%CI: MEM1 0.0 mg/kg, 23.89 ± 2.45; MEM1 6 mg/kg, 15.57 ± 4.12; MEM1 12.0 mg/kg, 8.06 ± 2.65; MEM1 25.0 mg/kg, 3.943 ± 1.779; MEM2 0.0 mg/kg, 13.69 ± 1.24; MEM2 6 mg/kg, 17.42 ± 2.71; MEM2 12.0 mg/kg, 15.33 ± 2.11; MEM2 25.0 mg/kg, 7.542 ± 2.082. D Both doses of Naltrexone reduced alcohol self-administration in both NTX1 (n = 47) and NTX2 (n = 35) clusters. Groups mean ± 95%CI: NTX1 0.0 mg/kg, 21.7 ± 2.09; NTX1 0.3 mg/kg, 11.17 ± 1.95; NTX1 1.0 mg/kg, 9.511 ± 1.787; NTX2 0.0 mg/kg, 15.06 ± 1.84; NTX2 0.3 mg/kg, 15.94 ± 2.51; NTX2 1.0 mg/kg, 12.23 ± 2.06. Bars represent the Mean ± 95% CI of number of rewards earned in a 30 min session. Statistical significance: *p < 0.05 and ****p < 0.0001 vs vehicle.
Fig. 3
Fig. 3. Effect of Memantine and Naltrexone treatment on saccharin self-administration in clusters based on individual effect of the drugs on ASA.
A All doses of Memantine reduced saccharin self-administration in MEM1 cluster. Groups mean ± 95%CI: 0.0 mg/kg, 54.18 ± 10.69; 6 mg/kg, 28.17 ± 12.8; 12.0 mg/kg, 17.61 ± 7.22; 25.0 mg/kg, 8.912 ± 3.94. B All doses of Memantine reduced saccharin self-administration in and MEM2 cluster. Groups mean ± 95%CI: 0.0 mg/kg, 54.83 ± 8.6; 6 mg/kg, 37.48 ± 11.74; 12.0 mg/kg, 24.76 ± 9.07; 25.0 mg/kg, 11.17 ± 5.076. C Only by the highest dose of Naltrexone reduced Saccharin self-administration in cluster NTX1. Groups mean ± 95%CI: 0.0 mg/kg, 53.24 ± 9.42; 0.3 mg/kg, 45.93 ± 8.97; 1.0 mg/kg, 36.67 ± 7.1. D Saccharin self-administration was reduced by both Naltrexone doses in cluster NTX2. Groups mean ± 95%CI: 0.0 mg/kg, 70.48 ± 14.11; 0.3 mg/kg, 56.41 ± 11.64; 1.0 mg/kg, 52.07 ± 9.41. Bars represent the Mean ± 95% CI of number of rewards earned in a 30 min session. Statistical significance: **p < 0.01, ***p < 0.001, and ****p < 0.0001 vs vehicle.
Fig. 4
Fig. 4. Prevalence of male and female rats in NTX-R and NTX-NR clusters.
A Relative (y-axis) and absolute (numbers within bars) frequencies of male and female rats in NTX-R and NTX-NR clusters. B Sex by Naltrexone clusters crosstabulation showing the difference between observed and expected count for each sex by cluster combination.
Fig. 5
Fig. 5. Comparison of alcohol drinking, motivation and cued reinstatement between NTX-R (female n = 17. male n = 30) and NTX-NR (female n = 25. male n = 10) cluster.
A Factor analysis using principal component extraction followed by varimax normalized rotation of alcohol drinking in three-bottle choice test (3BC), break point in progressive ratio test (PR) and cued reinstatement test (Cue). B Male and female NTX-R and NTX-NR rats showed similar level of daily alcohol intake at both 5% and 10% alcohol concentration in three-bottle choice test. Groups mean ± 95%CI: Female alcohol 5%, NTX-R 2.098 ± 0.947, NTX-NR 1.661 ± 0.603; Female alcohol 10%, NTX-R 1.25 ± 0.451, NTX-NR 1.461 ± 0.561; Male alcohol 5%, NTX-R 0.988 ± 0.277, NTX-NR 0.84 ± 0.495; Male alcohol 10%, NTX-R 0.842 ± 0.235, NTX-NR 1.321 ± 1.162. C Male and female NTX-R and NTX-NR rats showed similar level of motivation expressed by the break point reached under PR contingency over three consecutive PR sessions. Groups mean ± 95%CI: Female session1, NTX-R 8.353 ± 2.596, NTX-NR 8.6 ± 1.39; Female session2, NTX-R 7.294 ± 2.403, NTX-NR 6.04 ± 1.127; Female session3, NTX-R 6.118 ± 2.418, NTX-NR 4.96 ± 0.964; Male session1, NTX-R 8.667 ± 1.722, NTX-NR 6.9 ± 2.79; Male session2, NTX-R 7.7 ± 1.157, NTX-NR 6.8 ± 1.679; Male session3, NTX-R 7.2 ± 1.191, NTX-NR 7.0 ± 1.686. D Alcohol olfactory, taste and visual cues reinstated alcohol seeking in both NTX-R and NTX-NR female rats and in NTX-R male rats but not in NTX-NR male rats. Groups mean ± 95%CI: Female Ext, NTX-R 8.176 ± 2.392, NTX-NR 8.72 ± 2.163; Female Cue, NTX-R 17.47 ± 5.7, NTX-NR 19.36 ± 3.1; Male Ext, NTX-R 7.433 ± 2.375, NTX-NR 12.1 ± 12.86; Male Cue, NTX-R 23.43 ± 6.685, NTX-NR 13.6 ± 6.025. Bars represent the Mean ± 95%CI of respectively B) average 24 h alcohol intake, C) break point, and D) number active lever presses produced in a 30 min session on the last day of extinction (Ext) and on cued reinstatement test (Cue). Statistical significance: *p < 0.05, ***p < 0.001, and ****p < 0.0001 vs Ext same group.

Similar articles

References

    1. WHO. Global status report on alcohol and health. World Health Organization editors. Switzerland, 2018.
    1. Edwards G, Gross MM. Alcohol dependence: provisional description of a clinical syndrome. Br Med J. 1976;1:1058–61. - PMC - PubMed
    1. Edwards G, Gross MM, Keller M, Moser J. Alcohol-related problems in the disability perspective. A summary of the consensus of the WHO group of investigators on criteria for identifying and classifying disabilities related to alcohol consumption. J Stud Alcohol. 1976;37:1360–82. - PubMed
    1. Spanagel R. Alcoholism: a systems approach from molecular physiology to addictive behavior. Physiol Rev. 2009;89:649–705. - PubMed
    1. Spanagel R, Kiefer F. Drugs for relapse prevention of alcoholism: ten years of progress. Trends Pharmacol Sci. 2008;29:109–15. - PubMed

MeSH terms