. 2025 Jun 24;11(1):66.
doi: 10.1038/s41540-025-00543-9.

Region-specific mean field models enhance simulations of local and global brain dynamics

Affiliations

Region-specific mean field models enhance simulations of local and global brain dynamics

Roberta Maria Lorenzi et al. NPJ Syst Biol Appl. .

Abstract

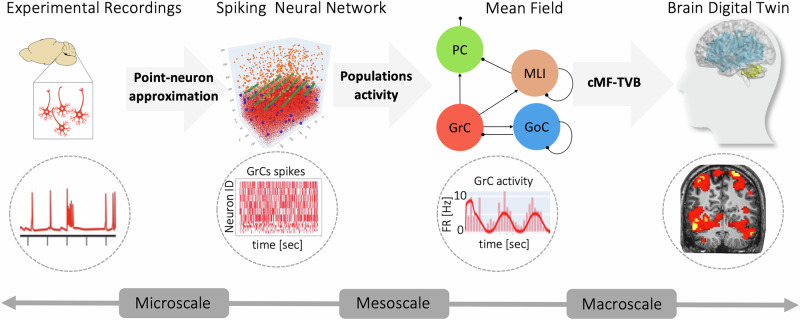
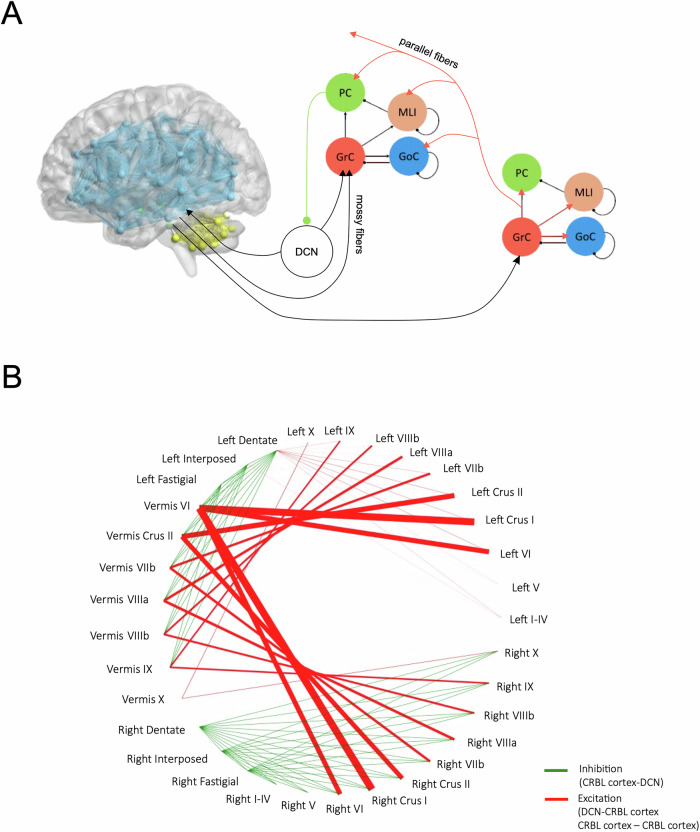
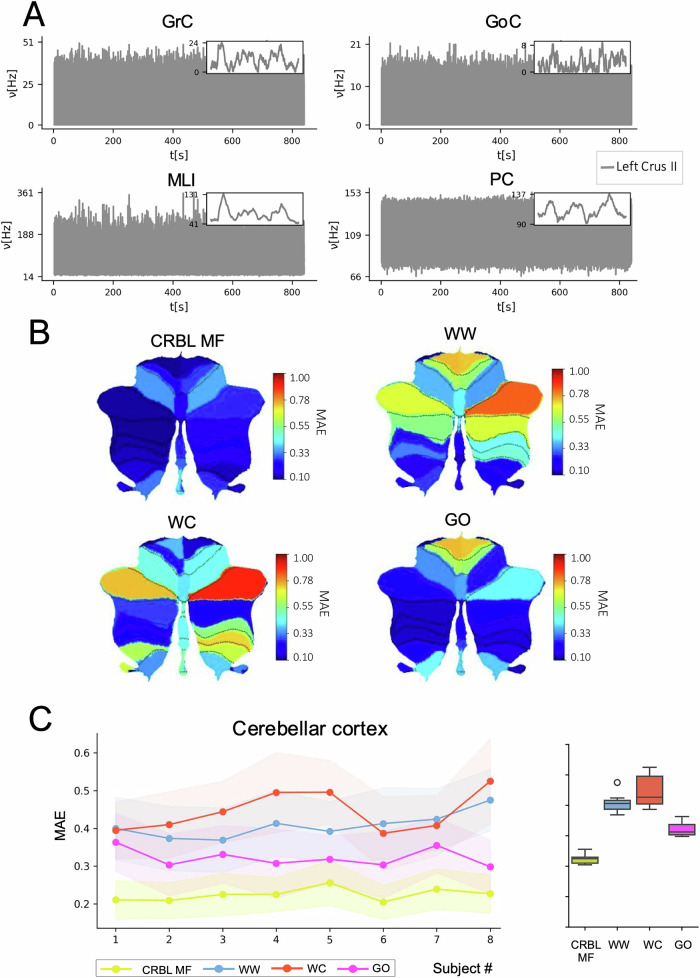
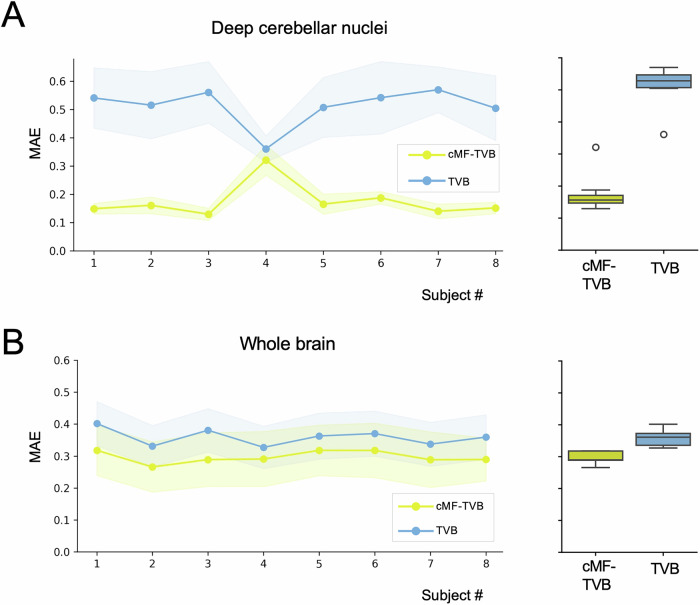
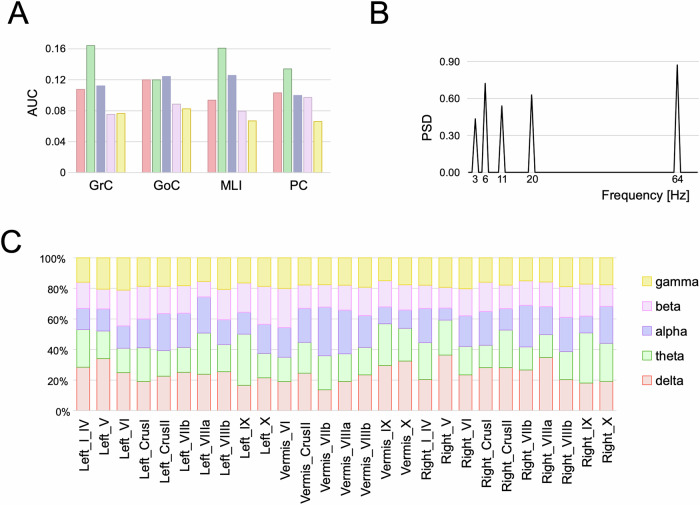
Brain dynamics can be simulated using virtual brain models, in which a standard mathematical representation of oscillatory activity is usually adopted for all cortical and subcortical regions. However, some brain regions have specific microcircuit properties that are not recapitulated by standard oscillators. Moreover, magnetic resonance imaging (MRI)-based connectomes may not be able to capture local circuit connectivity. Region-specific models incorporating computational properties of local neurons and microcircuits have recently been generated using the mean field (MF) approach and proposed to impact large-scale brain dynamics. Here, we have used a MF of the cerebellar cortex to generate a mesoscopic model of the whole cerebellum featuring a prewired connectivity of multiple cerebellar cortical areas with deep cerebellar nuclei. This multi-node cerebellar MF was then used to substitute the corresponding standard oscillators and build up a cerebellar mean field virtual brain (cMF-TVB) for a group of healthy human subjects. Simulations revealed that electrophysiological and fMRI signals generated by the cMF-TVB significantly improved the fitness of local and global dynamics with respect to a homogeneous model made solely of standard oscillators. The cMF-TVB reproduced the rhythmic oscillations and coherence typical of the cerebellar circuit and allowed to correlate electrophysiological and functional MRI signals to specific neuronal populations. In aggregate, region-specific models based on MF and pre-wired circuit connectivity can significantly improve virtual brain simulations, fostering the generation of effective brain digital twins that could be used for physiological studies and clinical applications.


Conflict of interest statement

Competing interests: The authors declare no competing interests.

Figures

Fig. 1
Fig. 1. Multiscale brain modelling.
An integrative approach to model cerebellar activity, bridging the gap between microscale and macroscale signals. The round panels illustrate the activity generated by GrC at different scales as an example of a multiscale modelling framework. Microscale experimental recordings (e.g. action potentials recorded in the GrC) are used to develop point-neuron models. These are wired into highly specific microcircuits, e.g. a cerebellar spiking neural network reproducing the spiking activity of cerebellar neurons, such as GrCs. The spiking neural network serves as the backbone of the CRBL MF, scaling up to the mesoscale by reproducing population activity in terms of firing rate (Hz). The cerebellar mean field model is then integrated into a virtual-brain simulator, ending up with the cMF-TVB that provides effective multiscale simulations.
Fig. 2
Fig. 2. Curation of intra-cerebellar SC.
A Cerebellar SC is curated by integrating microscale data, specifically the cerebellar spiking neural networks, with macroscale recordings, namely the subject-specific anatomical MRI acquisition. To quantify the connections between pairs of cerebellar cortical nodes, the convergence of parallel fibres from GrC to GoC, MLI, and PC is extracted from a cerebellar spiking neural network. Volumes of adjacent cerebellar regions are computed from subject-specific T13D images and summed to weight the population-specific synaptic convergences (i.e. GrC-GoC, GrC-MLI and GrC-PC). Volume-weighted synaptic convergences are normalised for the Intracranial Volume. The connectivity between cerebellar cortex and DCN is derived from anatomically constrained tractography computed on the pre-processed subject-specific diffusion-weighted images. The connection weights from cerebellar cortical nodes to the DCN nodes are made inhibitory and the feedback from DCN to cerebellar cortical nodes was reduced at 10% of the feedforward, accordingly to the physiology of the cerebellar circuit. B Curated cerebellar SC: Green edges represent inhibitory connections (from PC to DCN), while red edges represent excitatory connections made by parallel fibres between adjacent cerebellar cortex nodes. The thickness of the edges is proportional to the SC weights.
Fig. 3
Fig. 3. Schematic circuit representation of the cMF-TVB.
The cMF-TVB is built by interconnecting different models according to the spatial map defined by the SC. The cMF-TVB includes the multi-node CRBL MF, made of 27 MF models in the cerebellar cortex, hardwired with 6 WW models in DCN (yellow box), plus 93 WW models in the other brain nodes (light blue boxes). After segmentation and remapping in an atlas virtual space, each cerebellar region is attributed to a node and is represented with an MF. Connectivity between adjacent CRBL MF laying on the transverse plane corresponds to parallel fibres (parallel fibres) generated by GrCs in a source node (m) projecting its activity to GoC, MLI and PC in a target node (k), so that the coupling strength [Hz] from m to k through parallel fibres is Cppfs(k,m). Node k forwards the inhibitory activity of its PCs to the excitatory neurons of a DCN (j), which then sends back connections to node k, with coupling strength CPC(j,k) and Cmfs(k,j), respectively. Node k also receives the excitatory activity of a cerebral node (i), so that the coupling strength [Hz] from j to k through mossy fibres is Cmfs(k,i). DCN and the rest of the brain are coupled through the activity of their excitatory neurons (coupling C between standard oscillators is omitted for simplicity).
Fig. 4
Fig. 4. Multi-node CRBL MF.
A Cerebellar cortex neuronal activity, reported for left crus II as an example, is simulated using the CRBL MF integrated in the TVB platform for a randomly chosen subject taken from the Human Connectome Project dataset. The curated cerebellar structural connectivity was used to set the connections between different nodes (i.e. regions). To simulate the cerebellar cortex neuronal activity, namely the population-specific firing rate (νp with p = [GrC, GoC, MLI, PC]), one CRBL MF was associated with each node belonging to the cerebellar cortex. For each node, the simulated activity lies within the physiological range for each neuronal population. The inset panels show the first 50 ms of the simulation, revealing the different temporal fluctuations in firing activity of each population. Notably, the trend of MLI and PC is opposite, showing the inhibitory effects of MLI on PC. B BOLD signals are extracted from fMRI data (empBOLD) and simulated using, as generative model, either the CRBL MF or one of the generic unspecific models already available in the TVB platform (WW Wong-Wang, WC Wilson-Cowan, GO Generic Oscillator). The flat maps show the MAE between empirical and simulated BOLD, averaged across subjects for each cerebellar cortex region (cold colours correspond to a low MAE). The CRBL MF, as a generative model for BOLD signals, remarkably reduces the MAE in each cerebellar cortex region. C The single-subject MAE is computed for each subject by averaging the region-specific MAE over regions. The shaded areas represent the SEM, indicating inter-regional variability. When using the CRBL MF as a generative model for simulating BOLD signals, the MAE between simulated and empirical signals (~0.20) is significantly reduced compared to unspecific models (Mann–Whitney p value < 0.001).
Fig. 5
Fig. 5. cMF-TVB simulation of the cerebellar cortex activity.
Cerebellar cortex dynamics are evaluated from whole-brain dynamics simulated with cMF-TVB and compared to a simulation performed using the standard TVB. A Cerebellar cortex neuronal activity, namely the population-specific firing rate (νp with p = [GrC, GoC, MLI, PC]) reported for left crus II as an example, is simulated using the CRBL MF integrated in the TVB platform for a subject randomly chosen from the Human Connectome Project dataset. Curated whole-brain structural connectivity is used to map the connections between whole-brain nodes. To simulate the cerebellar cortex neuronal activity, a CRBL MF is associated with each node belonging to the cerebellar cortex, while WW is used for cerebral cortical and subcortical nodes. For each node, the simulated activity is within the physiological ranges for each neuronal population. Furthermore, the interconnection with cerebral nodes results in a heterogeneous activity of MLIs and PCs, driven by the heterogeneous weight input from the cerebral regions to the GrCs. The inset panels display the first 50 ms of the simulation, illustrating that temporal fluctuations in firing activity increase variability across all populations due to input from the cerebral region. B The flat maps show the MAE between empirical BOLD signals (extracted from fMRI data) and the simulated BOLD averaged over the subjects for each cerebellar cortex region (cold colour corresponds to low MAE) extracted from the whole brain simulation. cMF-TVB shows a better performance compared to the standard TVB (WW models in all nodes), reducing the MAE in each cerebellar cortex region. C The single-subject MAE is computed for each subject by averaging the cerebellar cortex region-specific MAE over cerebellar cortex regions. The shaded areas represent the SEM, indicating inter-regional variability. When using the cMF-TVB for simulating whole brain activity, the MAE between simulated and empirical signals (~0.25) is significantly reduced compared to the standard TVB (Mann–Whitney p value < 0.001).
Fig. 6
Fig. 6. cMF-TVB simulation of the whole brain.
Whole-brain activity was simulated with cMF-TVB (one CRBL MF associated with each cerebellar cortical node and one WW associated with each deep cerebellar nucleus and cerebrum node). MAE across subjects for cMF-TVB (yellow) and TVB (blue) models, shown as line plots with dots representing individual data points. The shaded areas represent the SEM, indicating inter-subject variability. A simBOLD signals of DCN were extracted from whole-brain simulations performed with either cMF-TVB or TVB. For each subject, simBOLD was averaged over regions and compared to empBOLD by computing the subject-specific MAE for cMF-TVB and TVB. cMF-TVB improves DCN simulations for all the subjects remarkably (except for subject 4, where cMF-TVB and TVB are comparable). Overall, the MAE is significantly reduced when using cMF-TVB (Mann–Whitney p value < 0.001), showing that the inclusion of a region-specific model (i.e. CRBL MF) improves local dynamics compared to non-specific models (e.g. WW). B The subject-specific MAEs between empBOLD and simBOLD using cMF-TVB and TVB are also computed for the whole brain simulation. For all the subjects, cMF-TVB improves the simulation performance significantly (Mann–Whitney p value < 0.001), highlighting that region-specific models can also improve global dynamics.
Fig. 7
Fig. 7. Cerebellar rhythms emerging from cMF-TVB simulations.
A For each population, the PSD is averaged across subjects to define the bands of circuit oscillations (delta = [0.4 4) Hz, theta = [4 8) Hz, alpha = [8 13) Hz, beta = [12 30) Hz, gamma = [30 100) Hz) for each neuronal population. The theta band is predominant in GrCs, MLIs, and PCs. B Predominant frequencies for each band (only frequencies with a PSD ≥ 0.4 are reported) computed on the cerebellar activity (HZ) averaged across populations. 64 Hz is the predominant frequency with a PSD = 0.87, revealing that a remarkable synchronisation of cerebellar populations’ activity occurs in the middle of the gamma band. C Activity bands in different cerebellar regions. The weight of each band is computed by summing the population-specific power (i.e. the normalised PSD area under the curve, (AUC)). The gamma band is around 20% in all regions, the beta band is usually less than 20% (except in vermis VI and lobules X), the delta, theta, and alpha bands show higher variability across regions.

Similar articles

References

    1. Arbib, M. A. Spanning the levels in cerebellar function. Behav. Brain Sci.19, 434–435 (1996).
    1. Sanz Leon, P. et al. The virtual brain: a simulator of primate brain network dynamics. Front. Neuroinform.7, 385–430 (2013). - PMC - PubMed
    1. Sanz-Leon, P., Knock, S. A., Spiegler, A. & Jirsa, V. K. Mathematical framework for large-scale brain network modeling in The Virtual Brain. Neuroimage111, 385–430 (2015). - PubMed
    1. Wang, H. E. et al. Virtual brain twins: from basic neuroscience to clinical use. Natl Sci. Rev.11, nwae079 (2024). - PMC - PubMed
    1. Breakspear, M. Dynamic models of large-scale brain activity. Nat. Neurosci.20, 340–352 (2017). - PubMed

LinkOut - more resources