. 2025 Jun 25;11(1):59.
doi: 10.1038/s41421-025-00807-y.

Molecular mechanism of pH sensing and activation in GPR4 reveals proton-mediated GPCR signaling

Affiliations

Molecular mechanism of pH sensing and activation in GPR4 reveals proton-mediated GPCR signaling

Chongzhao You et al. Cell Discov. .

Abstract

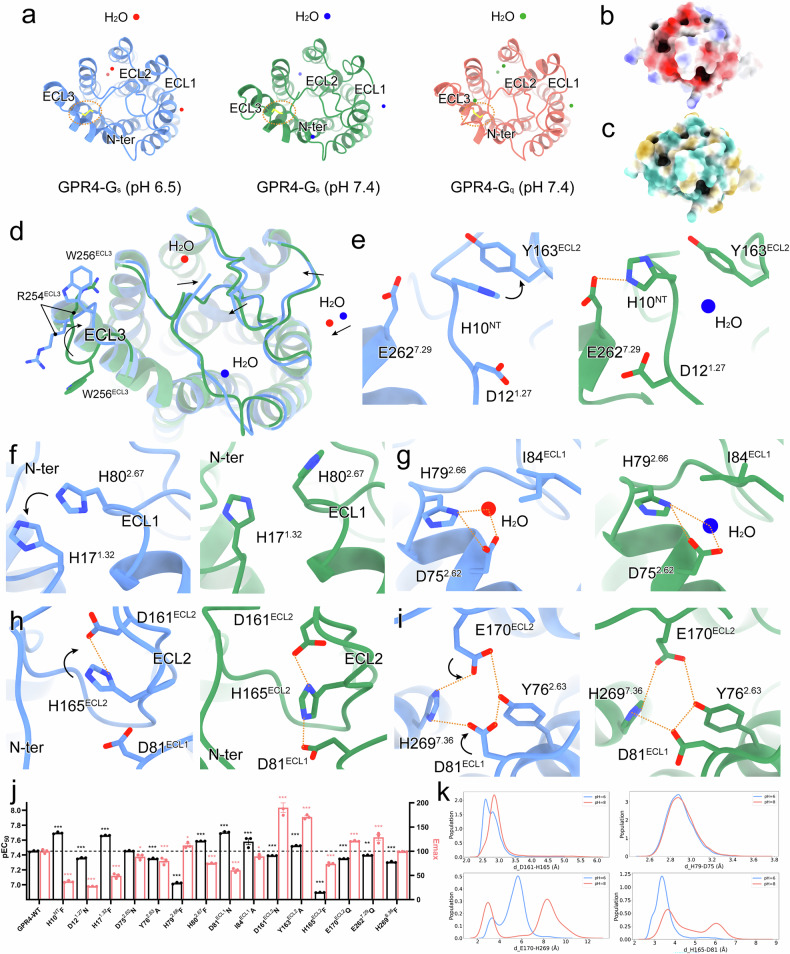
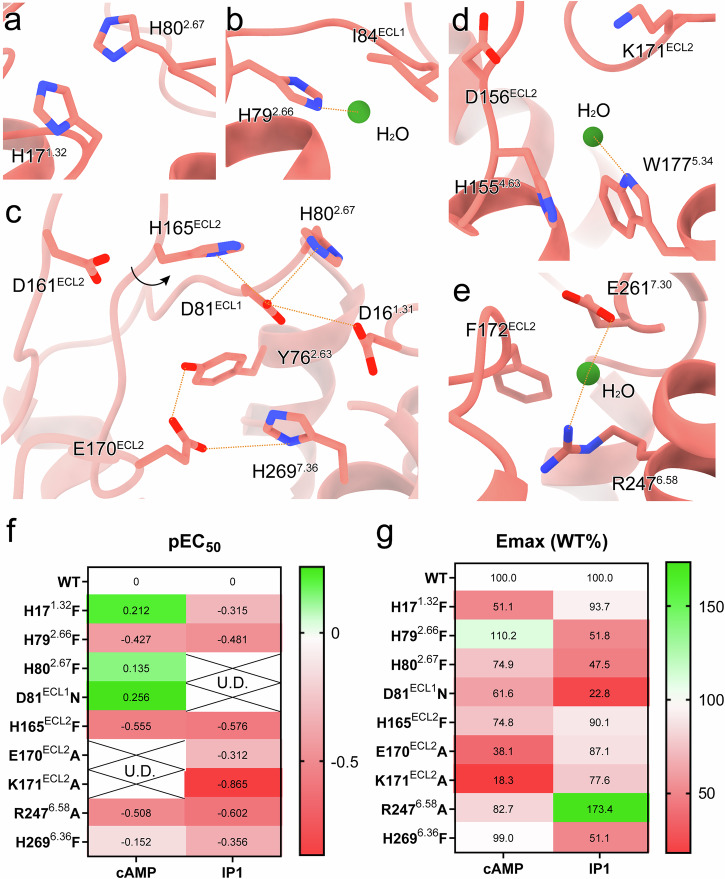
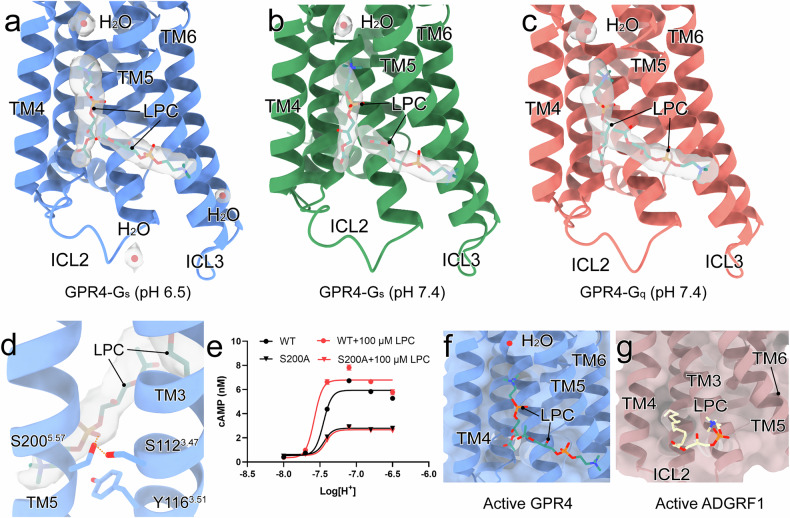
Maintaining pH homeostasis is critical for cellular function across all living organisms. Proton-sensing G protein-coupled receptors (GPCRs), particularly GPR4, play a pivotal role in cellular responses to pH changes. Yet, the molecular mechanisms underlying their proton sensing and activation remain incompletely understood. Here we present high-resolution cryo-electron microscopy structures of GPR4 in complex with G proteins under physiological and acidic pH conditions. Our structures reveal an intricate proton-sensing mechanism driven by a sophisticated histidine network in the receptor's extracellular domain. Upon protonation of key histidines under acidic conditions, a remarkable conformational cascade is initiated, propagating from the extracellular region to the intracellular G protein-coupling interface. This dynamic process involves precise transmembrane helix rearrangements and conformational shifts of conserved motifs, mediated by strategically positioned water molecules. Notably, we discovered a bound bioactive lipid, lysophosphatidylcholine, which has positive allosteric effects on GPR4 activation. These findings provide a comprehensive framework for understanding proton sensing in GPCRs and the interplay between pH sensing and lipid regulation, offering insights into cellular pH homeostasis and potential therapies for pH-related disorders.


Conflict of interest statement

Conflict of interest: H.E.X. is a founder of Cascade Pharmaceutics. All the other authors declare no competing interests.

Figures

Fig. 1
Fig. 1. Overall structures of GPR4–Gs/Gq complexes at acidic and physiological pH conditions.
a Schema diagram of GPR4 activation of Gs/Gq pathways at various pH conditions. b Curves showing pH-dependent cAMP accumulation in cells overexpressing GPR4 or pcDNA3.1. c LPC-induced activation of GPR4 at pH 7.4 measured in a dose-dependent manner using a cAMP accumulation assay. Values are represented as means ± SEM of three independent experiments (n = 3). df Overall structures and EM-density maps for GPR4 complexes. The receptors are colored blue (GPR4–Gs at pH 6.5), green (GPR4–Gs at pH 7.4), and salmon (GPR4–Gq at pH 7.4), respectively. Gαs subunit is colored wheat and Gαq subunit is colored purple. Colors of the Gβγ subunits are shown as indicated. Red balls refer to water molecules in our structures.
Fig. 2
Fig. 2. Proton recognition mode of GPR4.
a The top view of active GPR4 with the distribution of protons around ECD. The disulfide bonds are labeled by orange dashed circles and the water molecules are displayed as spheres. Colors are shown as indicated. b, c The surface of ECD in the GPR4–Gs complex at pH 6.5 by electrostatic (b) and hydrophobic (c) analyses. d The structural superposition of ECD in the GPR4–Gs complexes at pH 6.5 and pH 7.4. ei Detailed interactions and comparisons of GPR4 at pH 6.5 and pH 7.4. The displacement of residues and polar interactions are marked by black arrows and orange dashed lines, respectively. j Effects of GPR4 mutations on the potency of pH-induced cAMP accumulation. The black bars represent the pEC50 values of pH-induced responses in wild-type GPR4 (WT) and mutants, while the red bars indicate the maximum cAMP concentrations induced by pH in GPR4 WT and mutants, both normalized to WT. A decrease in pEC50 indicates reduced sensitivity to pH. The original data are provided in Supplementary Fig. S9. Values are shown as means ± SEM from three independent experiments. *P < 0.05, **P < 0.01 and ***P < 0.001 by one-way ANOVA followed by multiple comparison test, compared with WT. k The extracellular conformation distribution under pH 6.0 and pH 8.0. The side-chain minimal distance distribution of D161ECL2–H165ECL2, D752.62–H792.66, E170ECL2–H2697.36, and D81ECL1–H165ECL2.
Fig. 3
Fig. 3. Proton recognition mode of GPR4–Gq complex at physiological pH.
a The preserved interaction between H171.32 and H802.67. b The interaction between H792.66 and the common water molecule. c The extended polar network of H165ECL2 and H2697.36. The rotational direction of residues is labeled by a black arrow indicating the rotation of H165ECL2, compared with H165ECL2 in the GPR4–Gs complexes, and polar interactions are shown as orange dashed lines. d, e The special networks involving the water molecules in Gq-coupled GPR4. The water molecules are displayed as green spheres. The polar interactions are shown as orange dashed lines. f, g Effects of mutations on cAMP and IP1 accumulation responses. ΔpEC50 represents the difference between pEC50 values of GPR4 WT and mutants. U.D. means undetectable because the maximum activation level is below 50% to determine pEC50 values (f). Emax values represent the maximum cAMP or IP1 accumulation induced by various pH conditions in GPR4 WT and mutants, which are normalized to WT (g). Heat map is generated on the basis of the pEC50 or Emax. Values are shown as means of three independent experiments. The original data are provided in Supplementary Fig. S11.
Fig. 4
Fig. 4. Involvement of neutral phenylalanine and tyrosine residues in proton sensing.
ac Detailed interactions of phenylalanine residues in GPR4 complexes. The GPR4–Gs complexes are colored blue (pH 6.5) and green (pH 7.4), respectively. The GPR4–Gq complex at pH 7.4 is colored salmon. df Detailed interactions of tyrosine residues in GPR4 complexes. Polar interactions are marked by orange dashed lines. g Effects of mutations on GPR4-induced cAMP accumulation. Colors are shown as indicated. The original data are provided in Supplementary Fig. S9. Values are shown as means ± SEM from three independent experiments. h Conformation distribution under pH 6.0 and pH 8.0. The side-chain minimal distance distributions of E170ECL2–Y762.63 (upper) and E170ECL2–Y983.33 (lower) are shown.
Fig. 5
Fig. 5. Proton-induced activation state of GPR4.
a Overall structural comparison of the experimentally obtained GPR4–Gs complex at pH 6.5, the AlphaFold2 (AF2)-predicted GPR4 structure, the inactive structure of β2AR (PDB: 2RH1), and the simulated GPR4 at pH 8.0. bd The conformational changes of classical motifs in GPR4, including DRY (b), PIV (c), and DPxxY (d) motifs, compared with the inactive β2AR. e Conformational changes of ECD upon activation. N-terminus and ECLs assemble to transduce activation signals. The transparent ones refer to their original positions and the normal ones refer to their positions after activation. The black dashed arrows indicate displacement directions. f, g Detailed conformational changes of residues related to activation of GPR4–Gs at pH 6.5 compared to the simulated GPR4 at pH 8.0. The former is colored in blue, and the latter is colored in gray. h, i Structural comparisons between the active and the inactive (simulated) GPR4. j The potential propagation path for signal transduction. Related residues are highlighted. Black arrows represent the movements of the receptor and specific residues. k Schematic diagram showing the proton-induced activation mechanism of GPR4. Direct interactions induced by protons are displayed by black arrows, and black dashed arrows indicate the connection of residues and conformational rearrangements of residues.
Fig. 6
Fig. 6. Novel lipid regulation of GPR4.
ac The overall view of LPC-binding sites around GPR4–Gs at pH 6.5 (a) and pH 7.4 (b), and those around GPR4–Gq at pH 7.4 (c), respectively. LPCs and water molecules are shown as sticks and red balls, respectively. d The engaged residues between LPCs and TM3/5 of GPR4. The polar interactions are displayed by orange dashed lines. e The effect of S200A mutation on LPC positive allosteric activity measured by pH-induced cAMP accumulation in GPR4 WT or mutants with or without 100 μM LPC. Values are represented as means ± SEM of three independent experiments (n = 3). f, g Structural superposition of GPR4 and ADHRF1 (PDB: 7WU3).

Similar articles

References

    1. Kellum, J. A. Determinants of blood pH in health and disease. Crit. Care4, 6–14 (2000). - PMC - PubMed
    1. Sinning, A. & Hubner, C. A. Minireview: pH and synaptic transmission. FEBS Lett.587, 1923–1928 (2013). - PubMed
    1. Imenez Silva, P. H. & Wagner, C. A. Physiological relevance of proton-activated GPCRs. Pflug. Arch.474, 487–504 (2022). - PMC - PubMed
    1. Hopkins, E., Sanvictores, T. & Sharma, S. Physiology, acid base balance. In StatPearls (StatPearls Publishing, 2025). - PubMed
    1. Aoi, W. & Marunaka, Y. Importance of pH homeostasis in metabolic health and diseases: crucial role of membrane proton transport. Biomed. Res. Int.2014, 598986 (2014). - PMC - PubMed

LinkOut - more resources