. 2025 Jun 24;16(1):5370.
doi: 10.1038/s41467-025-58897-x.

In vivo self-renewal and expansion of quiescent stem cells from a non-human primate

Affiliations

In vivo self-renewal and expansion of quiescent stem cells from a non-human primate

Jengmin Kang et al. Nat Commun. .

Abstract

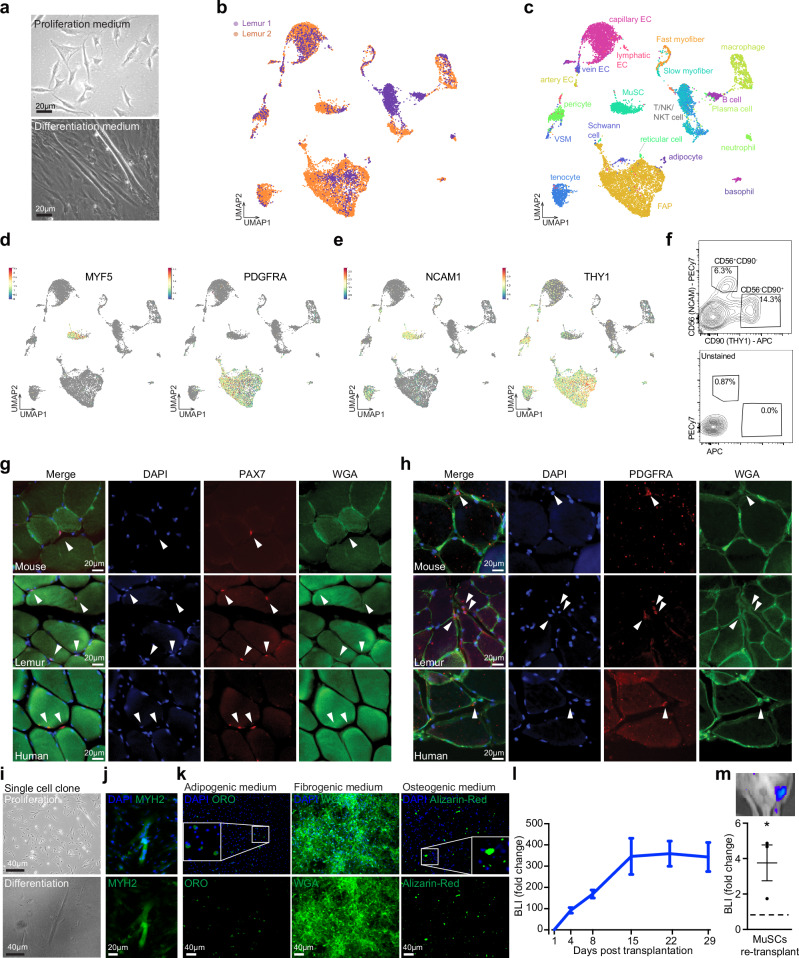
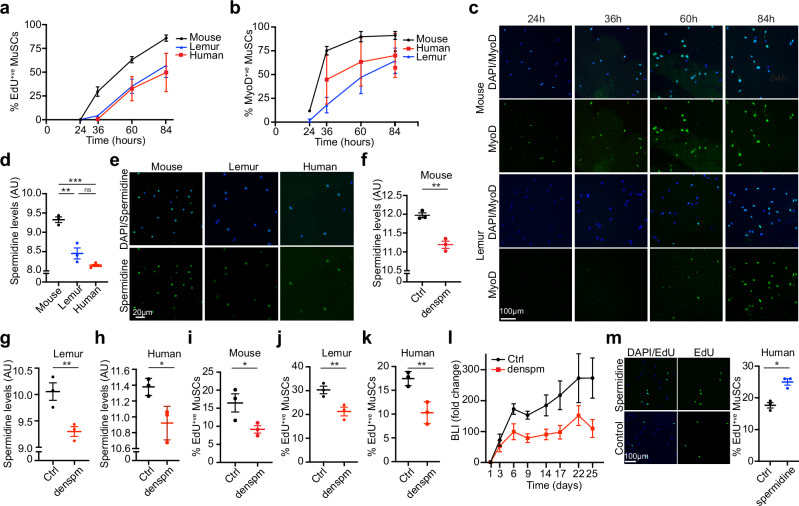
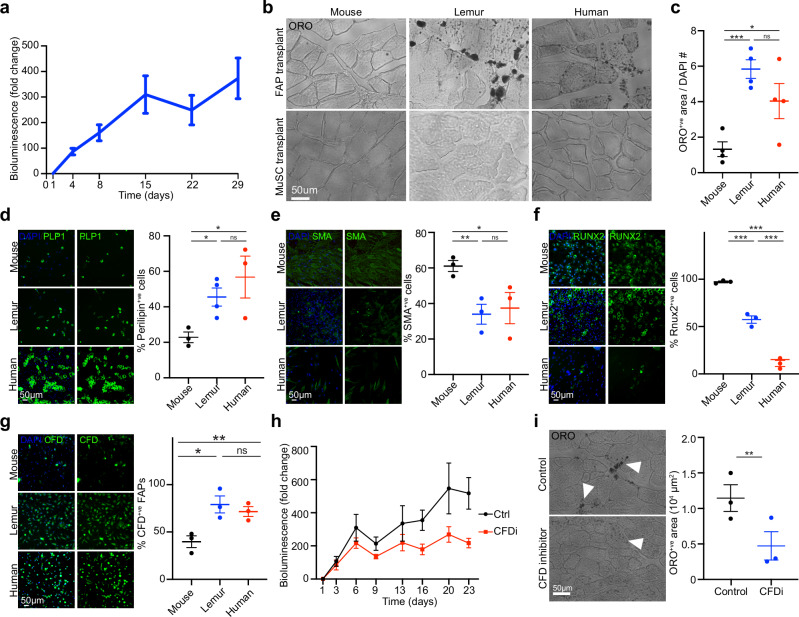
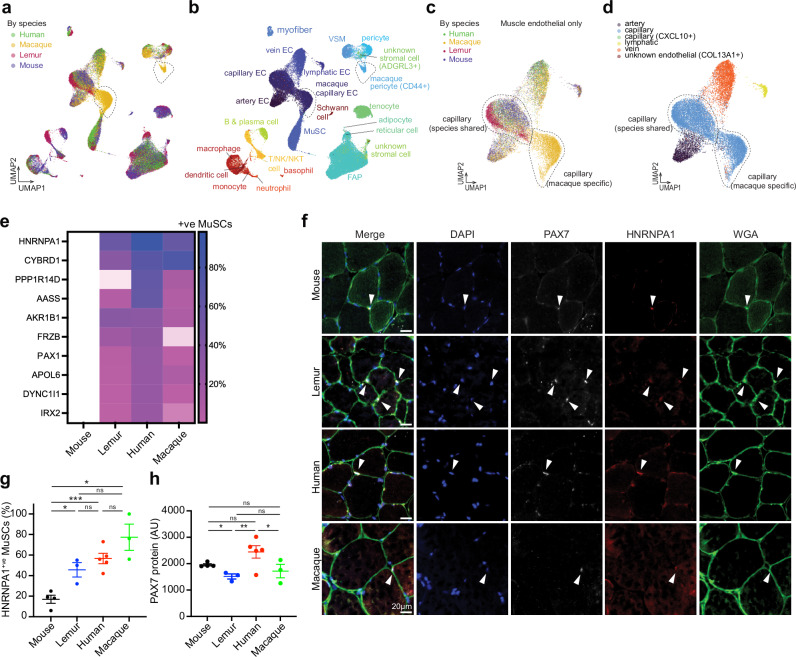
The development of non-human primate models is essential for the fields of developmental and regenerative biology because those models will more closely approximate human biology than do murine models. Based on single cell RNAseq and fluorescence-activated cell sorting, we report the identification and functional characterization of two quiescent stem cell populations (skeletal muscle stem cells (MuSCs) and mesenchymal stem cells termed fibro-adipogenic progenitors (FAPs)) in the non-human primate Microcebus murinus (the gray mouse lemur). We demonstrate in vivo proliferation, differentiation, and self-renewal of both MuSCs and FAPs. By combining cell phenotyping with cross-species molecular profiling and pharmacological interventions, we show that mouse lemur MuSCs and FAPs are more similar to human than to mouse counterparts. We identify unexpected gene targets involved in regulating primate MuSC proliferation and primate FAP adipogenic differentiation. Moreover, we find that the cellular composition of mouse lemur muscle better models human muscle than does macaque (Macaca fascicularis) muscle. Finally, we note that our approach presents as a generalizable pipeline for the identification, isolation, and characterization of stem cell populations in new animal models.


Conflict of interest statement

Competing interests: The authors declare no competing interests.

Figures

Fig. 1
Fig. 1. Identification of myogenic and mesenchymal stem cell/progenitor populations from mouse lemur skeletal muscle.
a Brightfield images of mouse lemur myogenic cells in proliferation (top panel) or differentiation (bottom panel) medium. Myogenic cells were obtained by pre-plating on plastic and grown on collagen-coated dishes. b, c UMAP plot of 10X single cell RNAseq data. Colors reflect the two replicates (b) or the different cell types (c). d UMAP plot as in (b, c), but now with MYF5-positive cells (top) or PDGFRA-positive cells (bottom) highlighted. e UMAP plot as in (b), but with NCAM1-positive cells (top) or THY1-positive cells (bottom) highlighted. f FACS plots for anti-NCAM1 and anti-THY1 staining (top) or no antibody control (bottom). g Muscle cryosections from indicated species were stained for PAX7 and counterstained for DAPI and WGA. Arrowheads mark PAX7+ nuclei in the MuSC position under the basal lamina. h Muscle cryosections from mouse, mouse lemur, and humans were stained for PDGFRα and counterstained for DAPI and WGA. Arrowheads mark interstitial PDGFRα+ cells. i Cells were grown from a single NCAM1+THY1 cell isolated by FACS. Cells were grown in high serum (top) or in low serum (bottom). j Myoclone-derived myotubes were stained for MYH2 protein. k NCAM1THY1+ cells were expanded for 7 days before treatment with indicated differentiation media. Cells were stained with Oil Red O, Wheat Germ Agglutinin, or Alizarin Red, respectively. Insets are magnified views of areas noted by the boxes. l Bioluminescence imaging (BLI) post-transplantation. Presumptive MuSCs (NCAM1+THY1) were purified by FACS, transduced with a lentivirus expressing GFP and Luciferase, and transplanted into the TA muscles of NSG recipient mice. n = 17 from 3 donors. Mice were imaged over time and normalized BLI signal was plotted as the mean plus standard error. m BLI after secondary transplantation. Engrafted MuSCs following transplantation (as in (l)) were purified by FACS and transplanted into the TA muscles of an irradiated NSG mouse. n = 3 from 3 donors. MuSC transplantation was followed by bioluminescence imaging and compared to control mice (irradiated, injured, but not transplanted). Image of BLI is shown on top. Data are presented as mean values ± SEM. The p-value was calculated by unpaired, two-tailed Student’s t-test (*p < 0.05, p = 0.0388). Source data are provided as a Source Data file.
Fig. 2
Fig. 2. Delayed quiescence exit in primate MuSCs.
a Time course of ex vivo EdU incorporation. n = 3. b, c Time course of MyoD protein expression during MuSC activation. Quantification is shown in (b), and representative images are shown in (c). n = 3 biological independent samples. d, e Freshly isolated MuSCs were stained for spermidine. Quantification is shown in (d) and representative images shown in (e). n = 3 biological independent samples. The p-values in (d) were calculated by unpaired, two-tailed Student’s t-test. ***p < 0.001 (p < 0.0001), **p < 0.01 (p = 0.0055), ns = p > 0.05 (p = 0.0537). f–h Proliferating MuSCs from mouse (f), n = 3 biological independent samples, mouse lemur (g), n = 3 biological independent samples, and human (h), n = 3 biological independent samples, were treated with SAT1 potentiator DENSPM or vehicle (Ctrl) for 24 h and stained for spermidine. ik Proliferating MuSCs from mouse (i), n = 3 biological independent samples, mouse lemur (j), n = 3 biological independent samples, and human (k), n = 3 biological independent samples, were treated with SAT1 potentiator DENSPM or vehicle (Ctrl) for 24 h in the presence of EdU and stained for EdU. l Freshly isolated mouse lemur MuSCs were transduced with luciferase-expressing lentivirus and treated with either the SRM potentiator DENSPM or vehicle (Ctrl). Cells were transplanted into the TA muscles of recipient mice. Transplanted legs received an additional intramuscular dose of 20 μl 2.5 mM DENSPM on days 3 and 6. Engraftment was monitored by BLI. n = 6 from 2 donors. m Freshly isolated human MuSCs were treated with 100 nM spermidine or vehicle in the presence of EdU. Quantification is shown on the right, and representative images are shown on the left. n = 3 biological independent samples. All statistical data in Fig. 2 are presented as mean values ±  SEM. All p-values in fk, m were calculated by paired, one-tailed Student’s t-tests. ***p < 0.001, **p < 0.01, *p < 0.05, ns = p > 0.05. The actual p-values were: f p = 0.009, g p = 0.005, h p = 0.0459, i p = 0.0214, j p = 0.0011, k p = 0.0025, m p = 0.0266. Source data are provided as a Source Data file.
Fig. 3
Fig. 3. CFD regulates the adipogenic fate of mouse lemur FAPs.
a BLI post-transplantation. Presumptive FAPs (NCAM1THY1+) were purified by FACS from three mouse lemurs, transduced with a lentivirus-expressing GFP and Luciferase, and transplanted into the TA muscles of NSG recipient mice. Mice were imaged over time and the normalized BLI signal was plotted as the mean plus standard error. n = 17 from 3 donors. b Freshly isolated FAPs (top panels) or MuSCs (bottom panels) from mice, lemur, or humans were transplanted into the TA muscles of NSG mice. One month post-transplantation, muscles were harvested, fixed, and frozen. Cryosections were stained with ORO. c Quantification of ORO stains shown in (b). n = 4 biological independent samples. The p-values were calculated by unpaired, two-tailed Student’s t-tests. ***p < 0.001 (p = 0.0005), *p < 0.05 (p = 0.0445), ns = p > 0.05 (0.1573). d–f Freshly isolated FAPs were expanded in vitro and treated with differentiation media for adipogenic (d), fibrogenic (e), or osteogenic (f) conversion. Cells were stained for Perilipin-1 (d), SMA (e), or RUNX2 (f). Left panels show representative images, right panels show graphs of quantification. n = 3 biological independent samples. g Freshly isolated FAPs were stained for CFD protein levels. Left panels show representative images, right panel shows the graph of quantifications (n = 3 biological independent samples). h Freshly isolated FAPs were transduced with luciferase-expressing lentivirus. Half of the cells were simultaneously treated with the CFD inhibitor Danicopan or vehicle (Ctrl). Cells were transplanted into the TA muscles of three recipient NSG mice. Engraftment was monitored by BLI. n = 6 from 2 donors. i Transplanted muscles from h were isolated, fixed, and stained for ORO. Left panels show representative images with arrowheads denoting ORO staining, right panels show graphs of quantification. n = 3 biological independent samples. All statistical data in this figure are presented as mean values ± SEM. The p-values in dg were calculated by unpaired, one-tailed Student’s t-test and marked as ***p < 0.001, **p < 0.01, *p < 0.05, ns = p > 0.05. The actual p-values were: d mouse vs. lemur p = 0.018, mouse vs. human p = 0.0247, lemur vs. human p = 0.1611; e mouse vs. lemur p = 0.0067, mouse vs. human p = 0.032, lemur vs. human p = 0.3781; f mouse vs. lemur p = 0.0003, mouse vs. human p = 0.0001, lemur vs. human p = 0.0006; g mouse vs. lemur p = 0.0111, mouse vs. human p = 0.0085, lemur vs. human p = 0.2536. The p-value in i was calculated by paired, two-tailed Student’s t-test (**p < 0.01, p = 0.0072). Source data are provided as a Source Data file.
Fig. 4
Fig. 4. Divergence of primate skeletal muscle stem cells.
a, b UMAP plot of 10X single cell RNAseq data. Colors reflect the four species (a) or the different cell types (b). Two cell clusters are specific to macaque, marked with dotted circles. c, d UMAP plot of 10X single-cell RNAseq data of the endothelial compartment only. Colors reflect the four species (c) or the different cell types (d). e Heatmap of the top 10 genes that are expressed in primate MuSCs but not in mouse MuSCs. f–h Muscle cryosections of indicated species were stained for HNRNPA1 and PAX7 and counterstained for DAPI and WGA. Arrowheads denote PAX7+HNRNPA1+ cells (f). Graphs show quantification of HNRNPA1+ MuSCs (g), and PAX7 staining intensity per MuSC (h). Statistical data in g and h are presented as mean values ± SEM. Sample sizes for g and h are: mouse n = 4 biological independent samples, lemur n = 3 biological independent samples, human n = 5 biological independent samples, macaque n = 3 biological independent samples. The p-values in g and h were calculated by unpaired, one-tailed Welch’s t-test and marked as ***p < 0.001, **p < 0.01, *p < 0.05, ns = p > 0.05. The actual p-values were: g mouse vs. lemur p = 0.0163, mouse vs. human p = 0.0002, lemur vs. human p = 0.1357, lemur vs. macaque p = 0.057, human vs. macaque p = 0.1193, mouse vs. macaque p = 0.0161; h mouse vs. lemur p = 0.0147, mouse vs. human p = 0.0546, lemur vs. human p = 0.0072, lemur vs. macaque p = 0.2578, human vs. macaque p = 0.0454, mouse vs. macaque p = 0.2252. Source data are provided as a Source Data file.

Update of

Similar articles

Cited by

  • Turning back time in the testes.
    Lloyd L. Lloyd L. Nat Rev Urol. 2025 Jul;22(7):409. doi: 10.1038/s41585-025-01060-4. Nat Rev Urol. 2025. PMID: 40533575 No abstract available.
  • A molecular cell atlas of mouse lemur, an emerging model primate.
    Tabula Microcebus Consortium; Ezran C, Liu S, Chang S, Ming J, Botvinnik O, Penland L, Tarashansky A, de Morree A, Travaglini KJ, Zhao J, Wang G, Hasegawa K, Sin H, Sit R, Okamoto J, Sinha R, Zhang Y, Karanewsky CJ, Pendleton JL, Morri M, Perret M, Aujard F, Stryer L, Artandi S, Fuller MT, Weissman IL, Rando TA, Ferrell JE Jr, Wang B, De Vlaminck I, Yang C, Casey KM, Albertelli MA, Pisco AO, Karkanias J, Neff N, Wu AR, Quake SR, Krasnow MA. Tabula Microcebus Consortium, et al. Nature. 2025 Aug;644(8075):173-184. doi: 10.1038/s41586-025-09113-9. Epub 2025 Jul 30. Nature. 2025. PMID: 40739356 Free PMC article.

References

    1. de Morree, A. & Rando, T. A. Regulation of adult stem cell quiescence and its functions in the maintenance of tissue integrity. Nat. Rev. Mol. Cell Biol. 24, 334–354 (2023). - PMC - PubMed
    1. Friedman, H. et al. The critical role of nonhuman primates in medical research. Pathog. Immun.2, 352–365 (2017). - PMC - PubMed
    1. Hong, H. S., Rajakumar, P. A., Billingsley, J. M., Reeves, R. K. & Johnson, R. P. No monkey business: why studying NK cells in non-human primates pays off. Front. Immunol.4, 32 (2013). - PMC - PubMed
    1. Beumer, J. & Clevers, H. Hallmarks of stemness in mammalian tissues. Cell Stem Cell31, 7–24 (2024). - PMC - PubMed
    1. Petty, N. E. et al. Efficient long-term multilineage engraftment of CD33-edited hematopoietic stem/progenitor cells in nonhuman primates. Mol. Ther. Methods Clin. Dev.31, 101121 (2023). - PMC - PubMed