. 2025 Jun;57(6):1260-1271.
doi: 10.1038/s12276-025-01472-7. Epub 2025 Jun 24.

Allogenic mitochondria transfer improves cardiac function in iPS-cell-differentiated cardiomyocytes of a patient with Barth syndrome

Affiliations

Allogenic mitochondria transfer improves cardiac function in iPS-cell-differentiated cardiomyocytes of a patient with Barth syndrome

Ye Seul Kim et al. Exp Mol Med. 2025 Jun.

Abstract

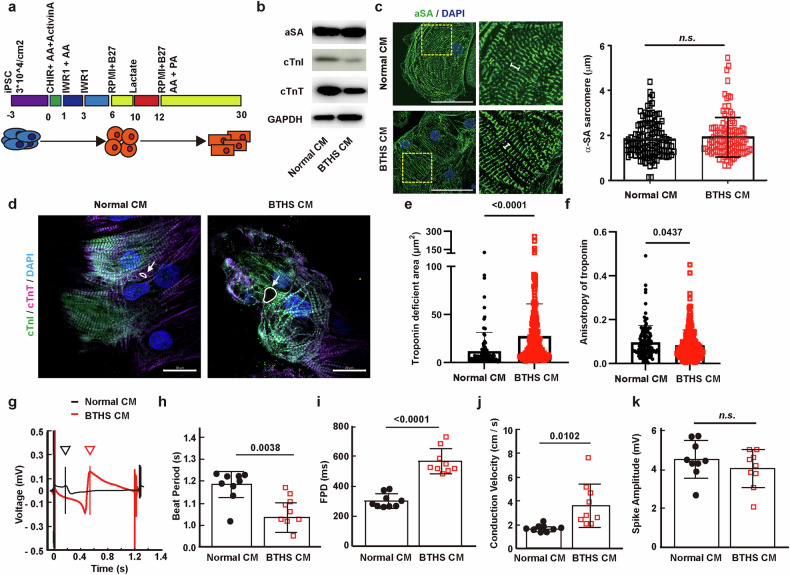
Barth syndrome (BTHS) is an ultrarare, infantile-onset, X-linked recessive mitochondrial disorder that primarily affects males, owing to mutations in TAFAZZIN, which catalyzes the remodeling of cardiolipin, a mitochondrial phospholipid required for oxidative phosphorylation. Mitochondrial transplantation is a novel technique to treat mitochondrial dysfunction by delivering healthy mitochondria to diseased cells or tissues. Here we explored the possibility of using stem-cell-derived cardiomyocytes as a source of mitochondrial transplantation to treat BTHS. We established induced pluripotent stem (iPS) cells from healthy individuals and from patients with BTHS and differentiated them into cardiomyocytes. The iPS-cell-differentiated cardiomyocytes (CMs) derived from patients with BTHS exhibited less expression of cardiomyocytes markers, such as α-SA, cTnT and cTnI, and smaller cell size than normal iPS-cell-derived CMs. Multielectrode array analysis revealed that BTHS CMs exhibited shorter beat period and longer field potential duration than normal CMs. In addition, mitochondrial morphology and function were impaired and mitophagy was decreased in BTHS CMs compared with normal CMs. Transplantation of mitochondria isolated from normal CMs induced mitophagy in BTHS CMs, mitigated mitochondrial dysfunction and promoted mitochondrial biogenesis. Furthermore, mitochondrial transplantation stimulated cardiac maturation and alleviated cardiac arrhythmia of BTHS CMs. These results suggest that normal CMs are useful for allogeneic transplantation in the treatment of mitochondrial diseases, including BTHS.


Conflict of interest statement

Competing interests: The authors declare no conflicts of interest. Study approval: This study was approved by the IRB Boards of Pusan National University (#PNU IRB/2021_25_BR) and Pusan National University Yangsan Hospital (#L-2021-34).

Figures

Fig. 1
Fig. 1. The patient’s genetic test result and pathogenicity of the variant.
a Sanger sequencing confirmed a novel heterozygous novel variant, c.137A>T (p.Asn46Ile) (NM_000116.3) in TAFAZZIN, which had been identified by targeted exome sequencing of the patient’s genome, which is indicated by the red arrow. Alignment of the predicted amino acid sequence of TAFAZZIN among different species is indicated by the dotted red box. Sequences were aligned with blastp (https://blast.ncbi.nlm.nih.gov/). b Wild-type and c mutant residues (p.Asn46Ile) in TAZ are colored light green and represented as sticks alongside the surrounding residues, which are involved in any type of interaction. Blue dots represent halogen bonds, red dots represent hydrogen bonds and orange dots represent weak hydrogen bonds. The crystal structure of the domain from wild-type TAZ was generated by SWISS-MODEL (https://swissmodel.expasy.org/) and is depicted as a cartoon representation. d Results from other predictive tools (NMA-based and other structure-based approaches) displayed to predict the mutation effect using the Dynamut web server with the normal mode analysis function (http://biosig.unimelb.edu.au/dynamut/). A visual representation of the Δ vibrational entropy energy is shown in which the amino acids are colored according to the vibrational entropy change upon mutation. Red regions indicate a gain in flexibility.
Fig. 2
Fig. 2. Characterization of cardiomyocytes derived from normal and BTHS iPS cells.
a A schematic diagram of cardiomyocyte differentiation from iPS cells. b The expression of cardiomyocyte and mitochondrial markers in normal and BTHS CMs at day 30. c Measurement of α-SA sarcomere length in immunocytochemistry on 63× magnification observation. Data are presented as mean ± s.d. (n = 6, biological statistics; n = ~83–185, technical statistics). Student’s t-test. n.s., not significant. d Immunocytochemistry of cTnT, cTnI and DAPI on day 30. Scale bar, 20 μm. Normal CMs and BTHS CMs were stained with anti-cTnT antibody (red color), anti-cTnI antibody (green color) and DAPI (nucleus staining; blue color), followed by analysis with confocal microscopy. The troponin-deficient area is indicated by the white arrows. e The cardiomyocyte marker troponin-deficient area was measured using ImageJ. n = ~108–223. f Anisotropy of cardiac troponin measured using ImageJ in d. n = 118–220. g A representative plot of the FPD in normal (black) and BTHS CMs (red) at day 30. h Mean of beat period. i Mean of FPD. j Conduction velocity. k Mean of spike amplitude. These are parameters of field potential values of g. The values are statistically measured through unpaired t-test with Welch’s correction. Biological repeat n = 9. Data are presented as mean ± s.d. n.s., not significant. Statistical significance was calculated using an unpaired, two-tailed t-test, and P values are indicated. iPSC, iPS cell.
Fig. 3
Fig. 3. Mitochondrial dysfunction and reduced mitochondrial biogenesis in BTHS CMs.
a The expression of mitochondrial proteins in normal and BTHS CMs. Western blotting was used to determine the protein levels of mitochondrial markers (PGC-1α, MIC60 and TOM20) and GAPDH. b Reduced mitochondrial DNA levels in BTHS CMs. ncDNA and mtDNA were quantified, and the ratio of mtDNA/ncDNA is shown (n = 5). c Decreased length and increased perimeter of mitochondria in BTHS CMs. Left: mitochondria were stained with MitoFlamma Deep Red in normal and BTHS CMs, and mitochondrial morphology was analyzed by confocal microscopy. Scale bar, 20 μm. Right: the mitochondrial perimeter was determined using ImageJ. Data are presented as mean ± s.d. (n = ~39–91). d Mitochondria and mitochondrial membrane potential were probed with MitoFlamma Green and TMRM dyes in normal and BTHS CMs at day 30 after inducing cell differentiation, and merged images are shown. Scale bar, 50 μm (n = 5). e Enhanced mitochondrial ROS in BTHS CMs. Normal and BTHS CMs were double stained with MitoSOX and MitoFlamma Green, and merged images are shown. Scale bar, 20 μm. Data are presented as mean ± s.d. (n = 4 ~ 5). Statistical significance was calculated using an unpaired, two-tailed t-test, and P values are indicated.
Fig. 4
Fig. 4. Allogenic transplantation of mitochondria isolated from normal CMs to BTHS CMs.
a A schematic diagram of transplantation schedule of mitochondria into BTHS CMs and isolation method of mitochondria from normal CMs. b Western blot analysis of cytosolic and mitochondrial fractions isolated from normal CMs. The expression of mitochondrial proteins (OPA1, COX4 and OXPHOS system (ATP5A, UQCRC2, MTCO1, SDHB and NDUFB8)) and cytosolic marker (GAPDH) were determined by western blotting. Triplicated experiments are shown. c Tracking of transplanted mitochondria in the recipient BTHS CMs. Mitochondria of BTHS CMs (red color) and normal CMs (green color) were labeled with MitoFlamma Deep Red and MitoFlamma Green, respectively. The recipient BTHS CMs were treated with mitochondria (green color) isolated from normal CMs. Co-localization of donor and recipient mitochondria is shown in a merged image. Scale bar, 50 μm. d Dose-dependent effects of mitochondrial transplantation. Mitochondria in normal CMs were labeled with MitoFlamma Green, isolated and dose-dependently treated to BTHS CMs. The levels of normal mitochondria transplanted into BTHS CMs were determined by FACS analysis, and the percentages of MitoFlamma Green-positive BTHS CMs are indicated. e BTHS CMs transplanted with mitochondria at a concentration of 5 pg per cell were assessed for cell viability using the WST-8 assay 1 week after transplantation. f Effects of mitochondrial transplantation on OXPHOS in BTHS CMs. The oxygen consumption rate (OCR) and extracellular acidification rate (ECAR) were recorded for 90 min. g Effects of mitochondrial transplantation on basal respiration, ATP production and maximal respiration. Statistical significance was calculated using one-way ANOVA with Holm–Šidák’s multiple-comparisons test, and P values are shown. The graphic diagram was created with BioRender.com.
Fig. 5
Fig. 5. Effects of mitochondrial transplantation on mitophagy in BTHS CMs.
a Effects of mitochondrial transplantation on mitochondrial morphology in BTHS CMs. Top: normal and BTHS CMs were stained with MitoFlamma (Deep Red) at the indicated times after mitochondria transplantation. Bottom: magnified images of the dotted area are shown. Arrowheads indicate mitochondria. Scale bar, 20 μm. b The mitochondrial perimeter was measured using ImageJ software. Data are presented as mean ± s.d. (n = ~39–91). c Effects of mitochondrial transplantation on mitophagy and autophagy in BTHS CMs. After transplantation of normal mitochondria into BTHS CMs, the expression and the phosphorylation levels of LC3, AMPKa, ULK, p70S6K and GAPDH were determined by western blot analysis 48 h after transplantation. d Effects of mitochondrial transplantation on mitochondrial morphology in BTHS CMs. Mitochondrial morphology of normal CMs, BTHS CMs and mitochondria-transplanted BTHS CMs analyzed by TEM analysis. Mitochondria (M) and autophagosome (A) are indicated. Scale bar, 1 μm. e Quantification of mitochondria fused with autophagosomes in TEM images. Data are presented as mean ± s.d. (n = ~10–12). f, g Cristae junction (f) and width (g) in the TEM images were measured by ImageJ software. Data are presented as mean ± s.d. (n = ~125–231). Statistical significance was calculated using one-way ANOVA with Holm–Šidák’s multiple-comparisons test, and P values are shown in the figures.
Fig. 6
Fig. 6. Effects of mitochondrial transplantation on expression of cardiac structure markers.
a Immunostaining of cTnT and MLC2v in normal CMs, BTHS CMs and BTHS CM + MT. Normal CMs, BTHS CMs and BTHS CMs transplanted with MT (48 h after transplantation) were stained with anti-cTnT antibody (green color), anti-MLC2v antibody (red color) and DAPI (blue color), respectively. Scale bar, 20 μm. b Effects of mitochondrial transplantation on expression of cardiac markers. Left: the expression levels of cardiac markers (α-SA, cTnT and cTnI) and GAPDH were determined by western blotting in normal CMs, BTHS CMs and BTHS CM + MT. Right: the protein band intensities were quantified using ImageJ software, and data are presented as mean ± s.d. (n = ~4–5). Statistical significance was calculated using one-way ANOVA with Holm–Šidák’s multiple-comparisons test, and P values are shown in the figures.
Fig. 7
Fig. 7. Effects of mitochondrial transplantation on electrophysiology of BTHS CMs.
a The field potentials of cardiomyocytes were analyzed using the Axion cardiac analysis tool. Representative plot of field potential and the duration records 12 h, 48 h and 1 week after normal mitochondrial transplantation in BTHS CMs. b A representative plot of field potential and the duration records after normal mitochondrial transplantation with concentrations of 2.5, 5 and 10 pg per cell in BTHS CMs for 1 week after transplantation. c Representative beat flow, including arrhythmias, at the electrodes during normal, BTHS and iPSC-CM transplantation with normal mitochondria after 1 week. d Calculation of the frequency of arrhythmias by measuring microelectrode array (MEA) in normal CMs, BTHS CMs and BTHS CM + MT (1 week after transplantation). e Effects of mitochondrial transplantation on the FPD of BTHS CMs. After transplantation of normal CM-derived mitochondria into BTHS CMs, the relative FPD values of BTHS CMs compared with those of normal CMs are shown. This analysis was produced by the Axion cardiac analysis tool and metric plotting tool. Data are presented as mean ± s.d. (n = ~10–11). Statistical significance was calculated using one-way ANOVA with Holm–Šidák’s multiple-comparisons test, and P values are shown in the figures.

Similar articles

Cited by

References

    1. Barth, P. G. et al. An X-linked mitochondrial disease affecting cardiac muscle, skeletal muscle and neutrophil leucocytes. J. Neurol. Sci.62, 327–355 (1983). - PubMed
    1. Neustein, H. B., Lurie, P. R., Dahms, B. & Takahashi, M. An X-linked recessive cardiomyopathy with abnormal mitochondria. Pediatrics64, 24–29 (1979). - PubMed
    1. Ferreira, C. et al. Barth Syndrome (eds M.P. Adam et al.) (University of Washington, 1993). - PubMed
    1. Jarvis, M., Garrett, P. & Svien, L. Gross motor development of a toddler with barth syndrome, an X-linked recessive disorder: a case report. Pediatr. Phys. Ther.13, 175–181 (2001). - PubMed
    1. Vanderniet, J. A., Benitez-Aguirre, P. Z., Broderick, C. R., Kelley, R. I. & Balasubramaniam, S. Barth syndrome with severe dilated cardiomyopathy and growth hormone resistance: a case report. J. Pediatr. Endocrinol. Metab.34, 951–955 (2021). - PubMed

LinkOut - more resources