. 2025 Jun 24;8(1):867.
doi: 10.1038/s42003-025-08274-7.

Bifidobacterium deficit in United States infants drives prevalent gut dysbiosis

Affiliations

Bifidobacterium deficit in United States infants drives prevalent gut dysbiosis

John B Jarman et al. Commun Biol. .

Abstract

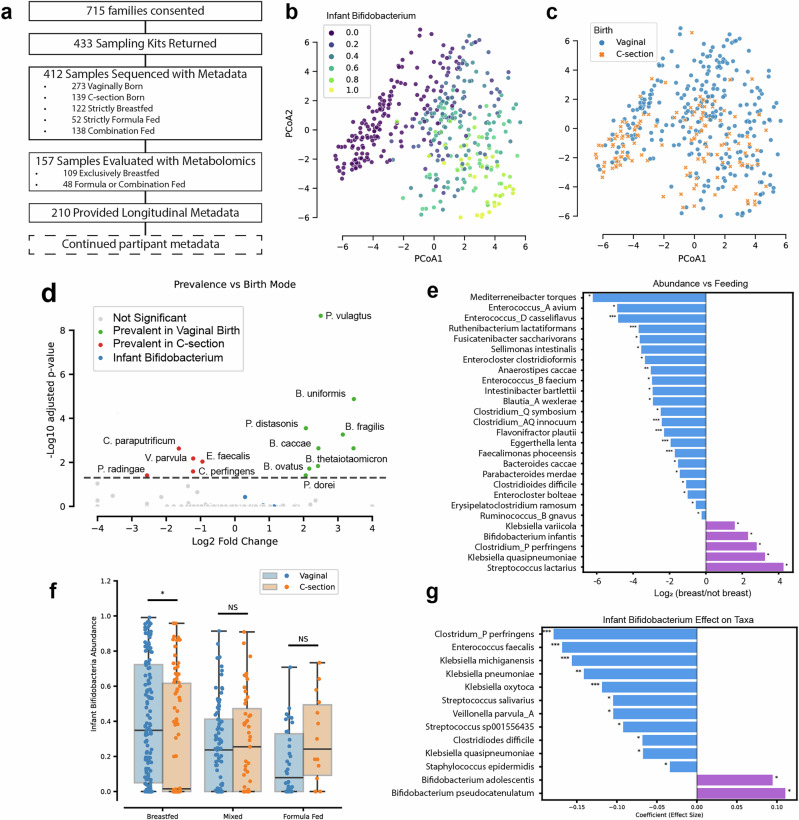
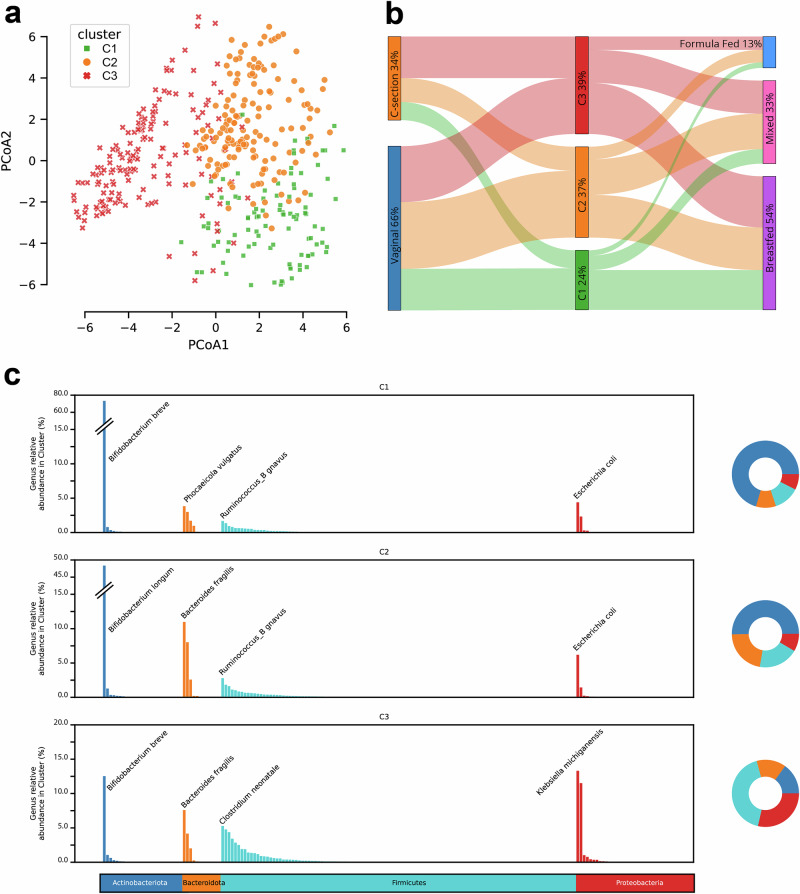
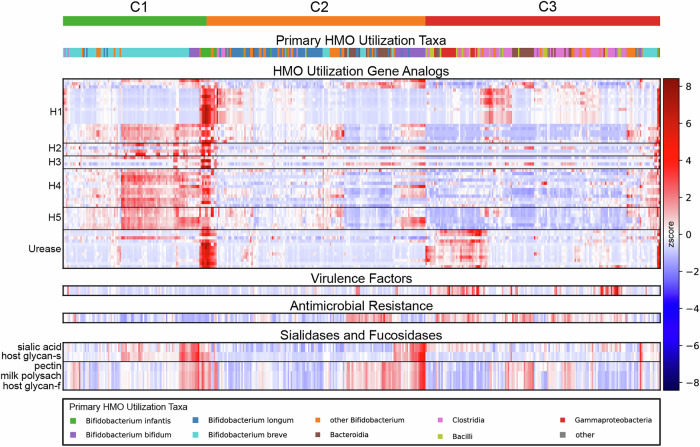
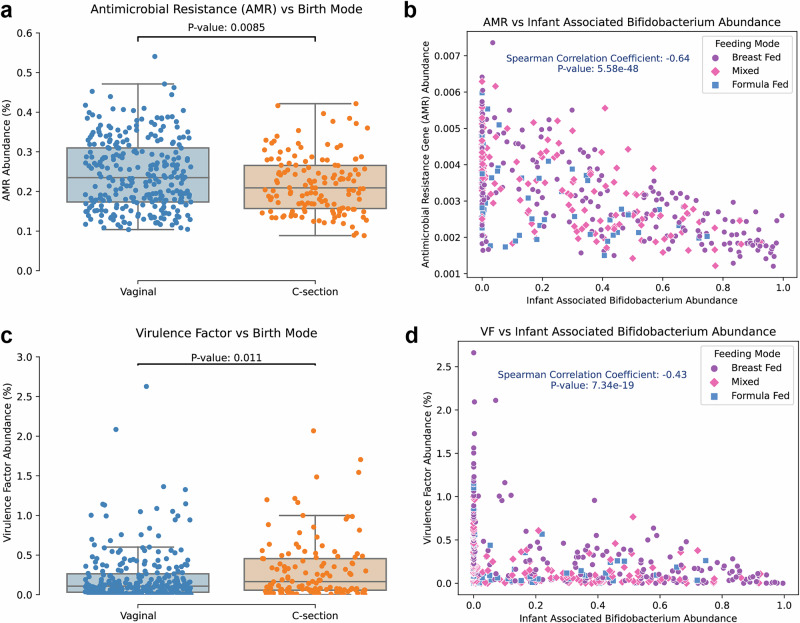
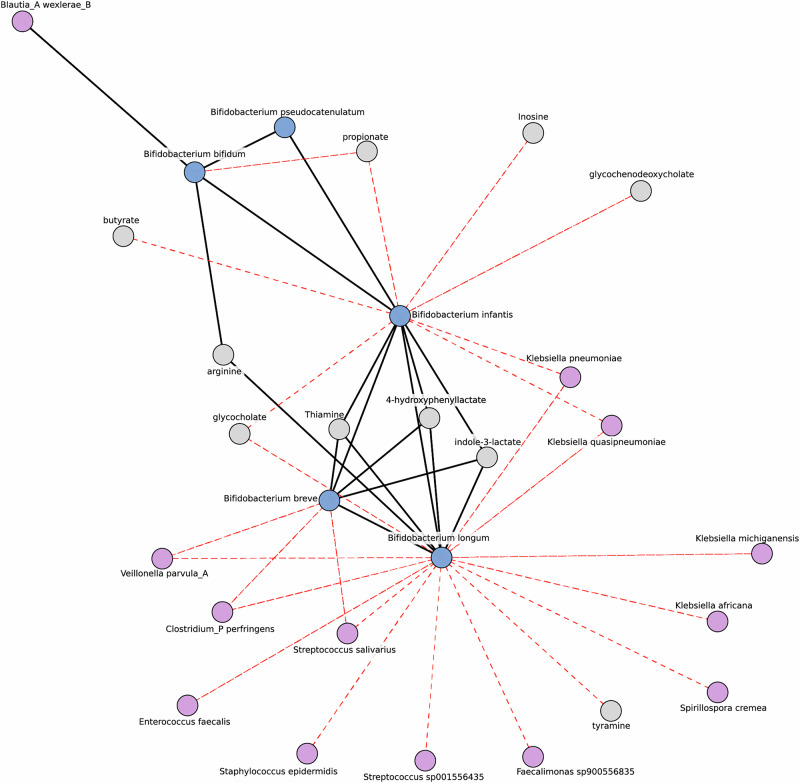
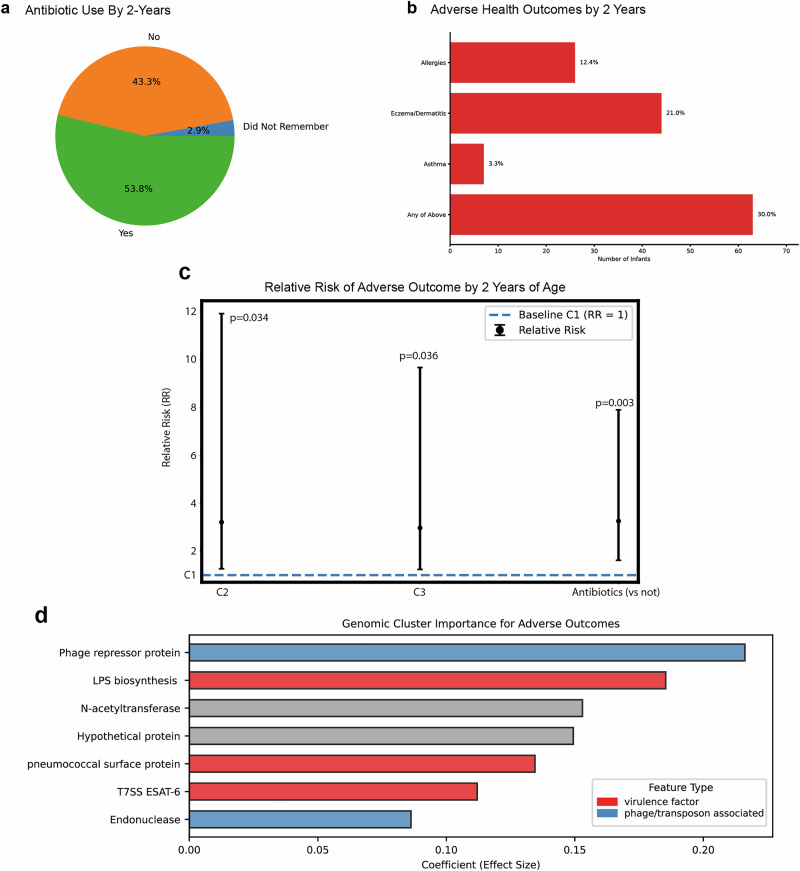
The composition of the infant gut microbiome is critical to immune development and noncommunicable disease (NCD) trajectory. However, a comprehensive evaluation of the infant gut microbiome in the United States is lacking. The My Baby Biome study, designed to address this knowledge gap, evaluated the gut microbiomes of 412 infants (representative of U.S. demographic diversity) using metagenomics and metabolomics. Regardless of birth mode and/or feeding method, widespread Bifidobacterium deficit was observed, with approximately 25% of U.S. infants lacking detectable Bifidobacterium. Bifidobacterium-dominant microbiomes exhibit distinct features when compared to microbiomes with other dominant microbial compositions including reduced antimicrobial resistance and virulence factor genes, altered carbohydrate utilization pathways, and altered metabolic signatures. In C-section birth infants, Bifidobacterium tended to be replaced in the human milk oligosaccharide utilization niche with potentially pathogenic species. Longitudinal health outcomes from these infants suggest that the disappearance of key Bifidobacterium may contribute to the development of atopy.


Conflict of interest statement

Competing interests: Research was funded by Persephone Biosciences. All authors were employed by and/or hold stock in Persephone Biosciences. RI also holds stock in Kenvue.

Figures

Fig. 1
Fig. 1. General features of infant gut microbiomes.
a Participant journey. b, c Aitchison distance PCoA plots of infant gut microbiomes in the My Baby Biome study (n = 412). Subfigure (b) is shaded to illustrate the relative abundance of infant associated Bifidobacterium (B. infantis, B. bifidum, B. breve, and B. longum), samples high in infant Bifidobacterium are seen in the lower right corner. Subfigure (c) is a PCoA showing organization of samples by birth mode. d Volcano plot for prevalence showing the conditional log odds-ratios (conditioned on birth mode) showing species that are observed significantly more often in vaginally born infants (green) or C-section (red). e Bar plot showing the log2 fold change in species abundance between exclusively breastfed and non-breastfed infants (including both formula-fed and mixed-fed) from ANCOVA analysis, adjusted for DNA collection/isolation method and birth mode. Positive (purple) indicates species enriched in breastfed infants, while negative (blue) values indicate enrichment in non-breastfed infants. f Infant Bifidobacterium abundances for each sample grouped by feeding mode and birth mode. g Bar plot showing GLM-derived association between infant Bifidobacteria presence and species abundance, adjusted for feeding mode and DNA collection/isolation method. Adjusted significance levels: where * is p < 0.05, ** is p < 0.01, *** is p < 0.001.
Fig. 2
Fig. 2. Groupings of infant gut microbiomes.
a Principal Coordinate Analysis (PCoA) of infant gut microbiomes with the Aitchison distance used to measure the similarity between samples. Clustering was performed with Dirichlet Multinomial Mixtures on species level counts, generating three clusters based on lowest Laplace approximation. b Significant associations were observed between the clusters and both birth mode (chi-squared < 0.01) and feeding mode (chi-squared < 0.05), with C3 having more C-section births, C2 having more vaginal births, and C1 having a preponderance of breastfed infants (C1 n = 99, C2 n = 151, C3 n = 162, vaginal birth n = 273, C-section n =  139, breastfed n = 222, mixed feeding n = 138, formula fed n = 52). c Genus-level relative abundance of bacterial taxa across three distinct clusters (C1, C2, and C3). Each cluster is visualized with a bar plot representing mean genus abundance, where genera are color-coded according to their corresponding phylum. The top species contributor for each phylum within each cluster is labeled above the corresponding genus bar. Additionally, each bar plot is accompanied by a pie chart that summarizes the overall phylum distribution for that cluster.
Fig. 3
Fig. 3. Functional genomics heatmaps.
Relative abundances of various functional genomic analyses are shown, with samples arranged in columns organized primarily by DMM cluster (top row) and functions arranged in rows. Signals along the rows are z-scored, with mean values shown in white, values above the mean shaded in red, and values below the mean shaded in blue. HMO gene analogs for each sample are presented where signals are accumulated by KEGG, gene name, and ortholog clustering for Bifidobacterium infantis blon genes organized into the HMO utilization clusters H1-H5 and Urease. The species contributing the most to the HMO utilization signals for each sample were tracked and the grouping is shown above; C1 HMO genes are most often coming from B. breve, C2 genes are frequently coming from B. longum, and C3 HMO genes primarily originate from species belonging to Clostridia, Bacilli, and Gammaproteobacteria. Virulence factors and Antimicrobial Resistance genes are seen to be more abundant in C3. Sialidases and fucosidases are more abundant in C2 and C1.
Fig. 4
Fig. 4. Virulence factors and antimicrobial resistance genes.
a Antimicrobial resistance (AMR) gene abundance for each sample was calculated and infants born vaginally are observed to have a statistically significant increase in AMR gene abundance. b AMR gene abundance is lower in samples with higher infant associated Bifidobacterium (Spearman p value < 1e-10, rho = -0.71). c Total virulence factor gene abundance was calculated for each sample and a significant increase in virulence factor abundance for C-section born infants was observed. d Virulence factor abundance is reduced as infant associated Bifidobacterium abundance is increased (Spearman p value < 1e-10, rho = −0.43).
Fig. 5
Fig. 5. Microbe-metabolite association network module.
This sparse inverse covariance network highlights associations in breastfed infants, centering on the infant Bifidobacterium module. Nodes are colored to distinguish Bifidobacterium (blue) and other microbes (purple) from metabolites (gray). Edges represent the inverse covariance, with their colors indicating the types of correlation: red for negative and black for positive. Only edges with an absolute covariance >0, a Pearson adjusted p value < 0.05 and an absolute correlation coefficient >0.2 are shown. This approach reduces the spurious correlations typically found in correlation networks.
Fig. 6
Fig. 6. Two year survey results and adverse health outcomes.
2-year follow-up survey responses were received from 210 participant families. a Statistics on antibiotic use are shown, with 53.8% of responding families reporting antibiotic use between birth and 2 years of age. b Responses on health outcomes are shown with the fractions of responders reporting allergies (n = 26), eczema/dermatitis (n = 44), and asthma (n = 7); 63 infants had at least one pediatrician-diagnosed adverse health outcome. c Relative risk (RR) plot showing GLM-derived associations between the infant gut microbiome clusters (C1, C2, C3) and adverse health outcomes by two years of age, adjusted for antibiotic exposure within the first two years. Points represent RR with 95% confidence intervals, and the dashed line indicates the baseline risk (C1 cluster; RR = 1). The impact of antibiotic use is shown for comparison. d Barplot showing gene cluster features associated with adverse outcomes, identified via a logistic regression machine learning model adjusted for antibiotic exposure in the first two years of life. Bars represent the average coefficient effect size from 10 cross-validation models, with colors indicating feature types: virulence factors (red) and phage-associated features (blue).

Similar articles

References

    1. Wang, H. et al. Global age-sex-specific fertility, mortality, healthy life expectancy (HALE), and population estimates in 204 countries and territories, 1950–2019: a comprehensive demographic analysis for the Global Burden of Disease Study 2019. Lancet396, 1160–1203 (2020). - PMC - PubMed
    1. Hanson, M. A. & Gluckman, P. D. Later health and disease: physiology or pathophysiology? Physiol. Rev.94, 1027–1076 (2014). - PMC - PubMed
    1. Strachan, D. P. Hay fever, hygiene, and household size. Biomed. J.299, 1259–1260 (1989). - PMC - PubMed
    1. Sonnenburg, E. D. & Sonnenburg, J. L. The ancestral and industrialized gut microbiota and implications for human health. Nat. Rev. Microbiol.17, 383–390 (2019). - PubMed
    1. Blaser, M. J. & Falkow, S. What are the consequences of the disappearing human microbiota?. Nat. Rev. Microbiol.7, 887–894 (2009). - PMC - PubMed

LinkOut - more resources