Clinical Trial
. 2025 Sep;31(9):3141-3150.
doi: 10.1038/s41591-025-03774-9. Epub 2025 Jun 24.

Tirzepatide on ingestive behavior in adults with overweight or obesity: a randomized 6-week phase 1 trial

Affiliations
Clinical Trial

Tirzepatide on ingestive behavior in adults with overweight or obesity: a randomized 6-week phase 1 trial

Corby K Martin et al. Nat Med. 2025 Sep.

Abstract

Tirzepatide induces weight reduction but the underlying mechanisms are unknown. This 6-week phase 1 study investigated early effects of tirzepatide on energy intake. Male and female adults without diabetes (n = 114) and a body mass index from 27 to 50 kg per m2 were randomized 1:1:1 to blinded once-weekly tirzepatide or placebo, or open-label once-daily liraglutide. The primary outcome was change from baseline to week 3 in energy intake during an ad libitum lunch with tirzepatide versus placebo. Secondary outcomes assessed self-reported ingestive behavior and blood-oxygenation-level-dependent functional magnetic resonance imaging with food photos. Tirzepatide reduced energy intake versus placebo at week 3 (estimated treatment difference -524.6 kcal (95% confidence interval -648.1 to -401.0), P < 0.0001). With regard to secondary outcomes versus placebo, tirzepatide decreased overall appetite, food cravings, tendency to overeat, perceived hunger and reactivity to foods in the environment but did not impact volitional restriction of dietary intake. At week 3 versus placebo, tirzepatide did not statistically significantly impact blood-oxygenation-level-dependent activation to highly palatable food photos (aggregated category of high-fat, high-sugar foods and high-fat, high-carbohydrate foods) but decreased activation to high-fat, high-sugar food photos in the medial frontal and cingulate gyri, orbitofrontal cortex and hippocampus. Our results suggest tirzepatide reduces food intake, potentially by impacting ingestive behavior. ClinicalTrials.gov registration: NCT04311411 .


Conflict of interest statement

Competing interests: The institution of C.K.M. is supported by NORC Center Grant P30 DK072476 entitled Nutrition and Metabolic Health Through the Lifespan sponsored by NIDDK and by grant U54 GM104940 from the National Institute of General Medical Sciences, which funds the Louisiana Clinical and Translational Science Center. C.K.M. declares research funding from Eli Lilly and Company paid to his institution to perform the work described in this paper; research grants or contracts paid to his institution from Pack Health, American Society for Nutrition, RAND Corporation, Richard King Mellon Foundation (RKMF), Evidation Health, Leona M. and Harry B. Helmsley Charitable Trust, State of Louisiana Federal American Rescue Plan (ARP), USDA, The Henry M. Jackson Foundation for the Advancement of Military Medicine, Inc., University of Rochester (NY), Foundation for Food and Agriculture Research, Kroger Co. Zero Hunger/Zero Waste Foundation, National Institute for Health Research (NIHR), Weight Watchers, American Diabetes Association, Eli Lilly and Company, National Science Foundation (NSF) and National Institutes of Health (NIH); royalties from ABGIL; personal consulting fees from EHE Health and WondrHealth; honoraria from Obesity Action Coalition, Indiana University Bloomington, University of Alabama at Birmingham, Nutrition Obesity Research Center, Brigham Young University, University of Kansas Medical Center (KUMC), University of Southern California and Commission on Dietetic Registration; travel support from Indiana University Bloomington, University of Alabama at Birmingham, Nutrition Obesity Research Center, Brigham Young University, University of Kansas Medical Center (KUMC), University of Southern California and Commission on Dietetic Registration; provision of research materials from Eli Lilly and Company and Weight Watchers; participation on advisory boards for Duke University (NIH-funded trial) and University of Alabama at Birmingham NIH-funded Nutrition Obesity Research Center; mentorship for a junior investigator at the University of Nebraska–Lincoln who received an NIH-supported training grant; and participation in a Bray Course Planning Committee. O.T.C. declares a research grant from Eli Lilly and Company to his institution to perform the work described in this paper and research grants from NIH and Nestle, Inc., and has served on advisory boards for Novo Nordisk. D.A.K. declares clinical trial and research support from Eli Lilly and Company to his institution to perform the work described in this paper, as well as research support from the NIH. R.V.C. declares clinical trial support from Eli Lilly and Company and research support from Adipo Therapeutics. R.D.M. declares research grants from Grain Foods Foundation, Almond Board of California and Eli Lilly and Company; consulting fees from Mars Foods, General Mills Bright Seed and the Calorie Control Council; honoraria from Clean Label Conference, Columbia University, Sports Nutrition Plus, USDA, Michigan State University, American Diabetes Association, Mediterranean Diet Roundtable, American Society for Nutrition, American Italian Food Coalition and Healthy Aging Science Forum; participation on safety monitoring boards/advisory boards for NIDCD; and presidency of the American Society for Nutrition. U.D. declares a research grant from Eli Lilly and Company to her institution to perform the work described in this paper and research support from the NIH and the International Manganese Institute. S.C. declares payments to her institution to support the work described in this paper. S.S., H.N., A.K., S.U., L.B., E.P., A.H., M.M., D.O.S., Z.M. and T.C. are employees and shareholders of Eli Lilly and Company. D.S. declares no competing interests.

Figures

Fig. 1
Fig. 1. Trial profile and study design.
a, Trial profile of the number of participants who underwent screening, enrollment and randomization and the number of participants who completed the study. b, Study design. The assessments carried out included an ad libitum food intake test (primary objective at week 3); questionnaires assessing appetite (VAS), food cravings (FCI and FCQ-S), disinhibition, hunger and dietary restraint (Eating Inventory), susceptibility to the food environment (PFS) and impulsiveness (BIS); and BOLD fMRI (fasted). QD, once-daily; QW, once-weekly.
Fig. 2
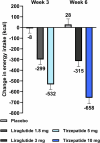
Fig. 2. Differences between treatment groups in changes in energy intake and body weight.
a, Least squares mean change from baseline (standard error), mean ETD and associated 95% CI from analysis of covariance for change in energy intake at week 3 in all randomized participants (placebo, n = 39; tirzepatide, n = 37). Statistical tests were two-sided at a significance level of 0.05 with adjustment for multiplicity. b, Mean ETD (center) and associated 95% CIs (whiskers) for change in energy intake at weeks 3 and 6. c, Mean ETD (center) and associated 95% CIs (whiskers) for change in body weight at weeks 3 and 6. For b and c, ETD was estimated using a MMRMs in all randomized participants (placebo, n = 39; tirzepatide, n = 37; liraglutide, n = 38). Statistical tests were two-sided at a significance level of 0.05 and adjustment was not made for multiplicity. ***P < 0.001 for comparisons between treatment groups. Statistical comparisons including exact P values are provided in Table 2 and Supplementary Table 1. ETD, estimated treatment difference. Source data
Fig. 3
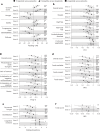
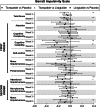
Fig. 3. Differences between treatment groups in changes in ingestive behavior and impulsiveness.
af, Data are presented as mean ETD (center) and associated 95% CIs (whiskers) for change in fasting VAS (a), FCI (b), FCQ-S (c), PFS (d), Eating Inventory (e) and BIS (f). ETD was estimated using a MMRMs in all randomized participants (placebo, n = 39; tirzepatide, n = 37; liraglutide, n = 38). Statistical tests were two-sided at a significance level of 0.05 and no adjustments were made for multiplicity. *P < 0.05, **P < 0.01, ***P < 0.001 for comparisons between treatment groups. Statistical comparisons including exact P values are provided in Table 2 and Supplementary Tables 4–7. Source data
Fig. 4
Fig. 4. Effects on brain activation in response to food cues at week 3 as assessed by BOLD fMRI.
a,b, Mean images of brain activation at baseline and week 3 (a) and least squares mean (standard error) change in BOLD fMRI parameters for highly palatable foods versus non-food objects at week 3 (b). c,d, Mean images of brain activation at baseline and week 3 (c) and least squares mean (standard error) change in BOLD fMRI parameters for high-fat, high-sugar foods versus non-food objects at week 3 (d). For each scan and each region, the mean of positive voxels was taken within each of the regions separately. The least squares mean was estimated using a MMRMs in all randomized participants who had available data (placebo, n = 33; tirzepatide, n = 31; liraglutide, n = 34). Statistical tests were two-sided at a significance level of 0.05 and no adjustments were made for multiplicity. No positive voxels (food > non-food) were identified for the ventral striatum; therefore, statistical analysis was not done on this region. *P < 0.05 versus placebo (high-fat, high-sugar foods versus non-food objects: medial frontal gyrus, P = 0.0335; cingulate gyrus, P = 0.0306; hippocampus, P = 0.0221; orbitofrontal cortex, P = 0.0321). Source data
Extended Data Fig. 1
Extended Data Fig. 1. Changes in energy intake.
Data are least squares mean (standard error) from mixed-model repeated measures for change in energy intake at week 3 and 6 in all randomized participants (placebo, n = 39; tirzepatide, n = 37; liraglutide, n = 38). Source data
Extended Data Fig. 2
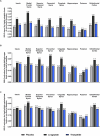
Extended Data Fig. 2. Changes in ingestive behaviour at week 3.
Data are least squares mean (standard error) from mixed-model repeated measures for change in A) pre-lunch appetite VAS scores, B) Food Craving Inventory, C) Food Craving Questionnaire-State, D) Eating Inventory, and E) Power of Food Scale, at week 3 in all randomized participants (placebo, n = 39; tirzepatide, n = 37; liraglutide, n = 38). VAS=visual analogue scale. Source data
Extended Data Fig. 3
Extended Data Fig. 3. Number of nausea and vomiting AEs reported by participants receiving tirzepatide over time.
AEs were classed as mild (shown in green), moderate (shown in orange), or severe (shown in red) in all participants randomized to tirzepatide (n = 37). AE=adverse events. Source data
Extended Data Fig. 4
Extended Data Fig. 4. Changes in ingestive behaviour at week 6.
Data are least squares mean (standard error) from mixed-model repeated measures for change in A) pre-lunch appetite VAS scores, B) Food Craving Inventory, C) Food Craving Questionnaire-State, D) Eating Inventory, and E) Power of Food Scale, at week 6 in all randomized participants (placebo, n = 39; tirzepatide, n = 37; liraglutide, n = 38). VAS=visual analogue scale. Source data
Extended Data Fig. 5
Extended Data Fig. 5. Differences between treatment groups in changes in Barratt Impulsiveness Scale scores.
Data are presented as mean ETD (centre) and associated 95% CIs (whiskers) for change in Barratt Impulsiveness Scale scores. ETD was estimated using an MMRM in all randomized participants (placebo, n = 39; tirzepatide, n = 37; liraglutide, n = 38). Statistical tests were two-sided at a significance level of 0.05, and no adjustments were made for multiplicity. *p < 0.05, **p < 0.01, ***p < 0.001 for comparisons between treatment groups. Statistical comparisons including exact p-values are provided in Table S7. ETD = estimated treatment difference. Source data
Extended Data Fig. 6
Extended Data Fig. 6. Baseline brain activation as assessed by BOLD fMRI.
Mean BOLD fMRI parameter activation at baseline for A) highly palatable foods vs non-food objects, B) high-fat/high-sugar foods vs non-food objects, and C) high-fat/high-carbohydrate foods vs non-food objects in all randomized participants who had available data (placebo, n = 33; tirzepatide, n = 31; liraglutide, n = 34). For each scan and each region, the mean of positive voxels was taken within each of the regions separately. No positive voxels (Food > Non-food) were identified for the ventral striatum; therefore, statistical analysis was not done on this region BOLD=blood oxygenation level dependent; fMRI=functional magnetic resonance imaging. Source data
Extended Data Fig. 7
Extended Data Fig. 7. Effects of highly palatable and high-fat/high-sugar foods versus non-food objects on brain activation at week 6 as assessed by BOLD fMRI.
A) Mean images of brain activation at baseline and week 6 and B) least squares mean (standard error) change in BOLD fMRI parameters for highly palatable foods vs non-food objects at week 6. C) mean images of brain activation at baseline and week 6 and D) least squares mean (standard error) change in BOLD fMRI parameters for high-fat/high-sugar foods vs non-food objects at week 6. For each scan and each region, the mean of positive voxels was taken within each of the regions separately. The least squares mean was estimated using an MMRM in all randomized participants who had available data (placebo, n = 33; tirzepatide, n = 31; liraglutide, n = 34). Statistical tests were two-sided at a significance level of 0.05, and no adjustments were made for multiplicity. No positive voxels (Food > Non-food) were identified for the ventral striatum; therefore, statistical analysis was not done on this region. †p < 0.05 vs liraglutide (medial frontal gyrus, p = 0.0156; cingulate gyrus, p = 0.0486; orbitofrontal cortex, p = 0.0219). BOLD=blood oxygenation level dependent; fMRI=functional magnetic resonance imaging. Source data
Extended Data Fig. 8
Extended Data Fig. 8. Effects of high-fat/high-carbohydrate food versus non-food objects on brain activation at week 3 and week 6 as assessed by BOLD fMRI.
Least squares mean (standard error) change in BOLD fMRI parameters for high-fat/high-carbohydrate food vs non-food objects A) at week 3 and B) at week 6. For each scan and each region, the mean of positive voxels was taken within each of the regions separately. The least squares mean was estimated using an MMRM in all randomized participants who had available data (placebo, n = 33; tirzepatide, n = 31; liraglutide, n = 34). Statistical tests were two-sided at a significance level of 0.05, and no adjustments were made for multiplicity. No positive voxels (Food > Non-food) were identified for the ventral striatum; therefore, statistical analysis was not done on this region. BOLD=blood oxygenation level dependent; fMRI=functional magnetic resonance imaging. Source data
Extended Data Fig. 9
Extended Data Fig. 9. Brain regions of interest.
Map of the prespecified brain regions of interest for BOLD fMRI. The dashed box shows the brain slice displayed in the results figures. No difference in signal was detected for the ventral striatum at baseline, week 3, or week 6; therefore, statistical analysis was not conducted for this brain region and this region is not shown. BOLD=blood oxygenation level dependent; fMRI=functional magnetic resonance imaging.

References

    1. Bray, G. A., Kim, K. K., Wilding, J. P. H. & World Obesity Federation. Obesity: a chronic relapsing progressive disease process. A position statement of the World Obesity Federation. Obes. Rev.18, 715–723 (2017). - PubMed
    1. Obesity and Overweight Key Facts. 2021 (World Health Organization, accessed 16 February 2024); www.who.int/news-room/fact-sheets/detail/obesity-and-overweight
    1. Carnell, S., Gibson, C., Benson, L., Ochner, C. N. & Geliebter, A. Neuroimaging and obesity: current knowledge and future directions. Obes. Rev.13, 43–56 (2012). - PMC - PubMed
    1. Chetty, A. K., Rafi, E., Bellini, N. J., Buchholz, N. & Isaacs, D. A review of incretin therapies approved and in late-stage development for overweight and obesity management. Endocr. Pract.30, 292–303 (2024). - PubMed
    1. Bettadapura, S., Dowling, K., Jablon, K., Al-Humadi, A. W. & le Roux, C. W. Changes in food preferences and ingestive behaviors after glucagon-like peptide-1 analog treatment: techniques and opportunities. Int. J. Obes.49, 418–426 (2025). - PMC - PubMed

Publication types

Associated data