Observational Study
. 2025 Sep;31(9):3011-3019.
doi: 10.1038/s41591-025-03785-6. Epub 2025 Jun 24.

AI-based large-scale screening of gastric cancer from noncontrast CT imaging

Affiliations
Observational Study

AI-based large-scale screening of gastric cancer from noncontrast CT imaging

Can Hu et al. Nat Med. 2025 Sep.

Abstract

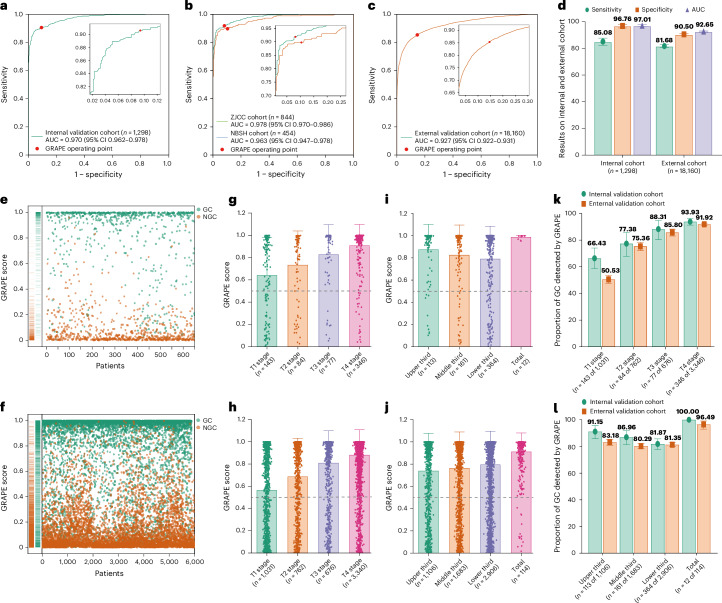
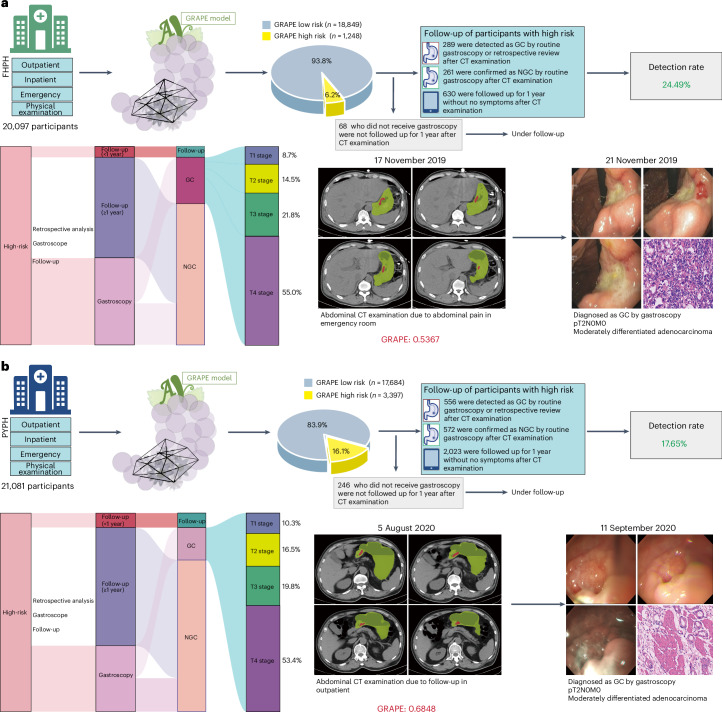
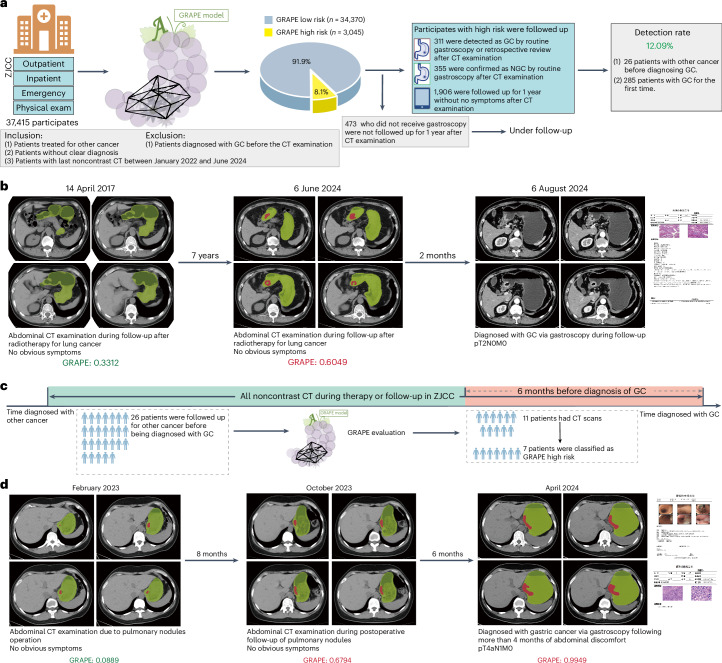
Early detection through screening is critical for reducing gastric cancer (GC) mortality. However, in most high-prevalence regions, large-scale screening remains challenging due to limited resources, low compliance and suboptimal detection rate of upper endoscopic screening. Therefore, there is an urgent need for more efficient screening protocols. Noncontrast computed tomography (CT), routinely performed for clinical purposes, presents a promising avenue for large-scale designed or opportunistic screening. Here we developed the Gastric Cancer Risk Assessment Procedure with Artificial Intelligence (GRAPE), leveraging noncontrast CT and deep learning to identify GC. Our study comprised three phases. First, we developed GRAPE using a cohort from 2 centers in China (3,470 GC and 3,250 non-GC cases) and validated its performance on an internal validation set (1,298 cases, area under curve = 0.970) and an independent external cohort from 16 centers (18,160 cases, area under curve = 0.927). Subgroup analysis showed that the detection rate of GRAPE increased with advancing T stage but was independent of tumor location. Next, we compared the interpretations of GRAPE with those of radiologists and assessed its potential in assisting diagnostic interpretation. Reader studies demonstrated that GRAPE significantly outperformed radiologists, improving sensitivity by 21.8% and specificity by 14.0%, particularly in early-stage GC. Finally, we evaluated GRAPE in real-world opportunistic screening using 78,593 consecutive noncontrast CT scans from a comprehensive cancer center and 2 independent regional hospitals. GRAPE identified persons at high risk with GC detection rates of 24.5% and 17.7% in 2 regional hospitals, with 23.2% and 26.8% of detected cases in T1/T2 stage. Additionally, GRAPE detected GC cases that radiologists had initially missed, enabling earlier diagnosis of GC during follow-up for other diseases. In conclusion, GRAPE demonstrates strong potential for large-scale GC screening, offering a feasible and effective approach for early detection. ClinicalTrials.gov registration: NCT06614179 .


Conflict of interest statement

Competing interests: Alibaba Group has filed for patent protection ( CN116188392 ; the other application number is not currently in the public domain) for the work related to the methods of detection of GC in noncontrast CT. Y.X., Z.Z., Jianwei Xu, Z.Q., T.L., B.Y., J.Y., W.G., J.Z. and Ling Zhang are employees of Alibaba Group and own Alibaba stock as part of the standard compensation package. The other authors declare no competing interests.

Figures

Fig. 1
Fig. 1. Overview of the development, evaluation and clinical translation of GRAPE.
a, Model development. GRAPE takes noncontrast CT as input and outputs the probability and the segmentation mask of possible primary gastric lesions. GRAPE was trained with noncontrast CT from gastroscope-confirmed GC patients. The performance of GRAPE was evaluated via GRAPE scores, ROC curves and so on. b, Overview of the training cohort, internal validation cohort and external validation cohort. c, Overview of reader studies. d, Real-word study. The performance of GRAPE in realistic hospital opportunistic screening was validated using two real-world study cohorts, including a regional hospital cohort and a cancer center cohort.
Fig. 2
Fig. 2. GRAPE performance in internal and external validation cohorts.
a, ROC curve of GRAPE in an internal validation cohort. b, ROC curve of GRAPE in ZJCC and NBSH in internal validation cohort. c, ROC curve of GRAPE in external validation cohort. d, Sensitivity, specificity and AUC of GRAPE in internal and external validation cohorts. e,f, Distribution of GRAPE scores of GC and NGC in the internal (e) and external (f) validation cohorts. g,h, GRAPE scores in different T stages in internal (g) and external (h) validation cohorts. i,j, GRAPE scores in different locations in internal (i) and external (j) validation cohorts. k, Proportion of GC detected by GRAPE in different T stages in internal and external validation cohorts. l, Proportion of GC detected by GRAPE in different locations of the stomach in internal and external validation cohorts.
Fig. 3
Fig. 3. Reader study.
a, Comparison between GRAPE and 13 readers with 13 radiologists with different levels of expertise on GC. b, Performance in GC discrimination of the same set of radiologists with the assistance of GRAPE on noncontrast CT. c, Balanced accuracy improvement in radiologists with different levels of expertise for GC discrimination. d, Detection rate of EGC and AGC by radiologists alone, radiologists with the assistance of GRAPE and GRAPE alone. e, Detection rate of GC in different locations by radiologists alone, radiologists with the assistance of GRAPE and GRAPE alone. f, Examples of T1 and T2 GC discrimination by GRAPE, which were missed by readers.
Fig. 4
Fig. 4. Performance of GRAPE in realistic hospital opportunistic screening in regional hospitals validated using a real-world study cohort.
a, Overview of GRAPE’s performance in FHPH cohort and a case study. b, Overview of GRAPE’s performance in PYPH cohort and a case study.
Fig. 5
Fig. 5. Performance of GRAPE in realistic hospital opportunistic screening in cancer center validated using a real-world study cohort.
a, Overview of GRAPE’s performance in the ZJCC cohort. b, Illustration of GC patient diagnosed after detection using GRAPE. This patient was being followed up for lung cancer treatment in June 2024 but was detected by GRAPE. MDT review showed that the patient underwent gastroscopy and was diagnosed with moderately differentiated to well-differentiated GC in August 2024. c, Data collection process of prediagnosis CT scans. Among 26 patients under follow-up for other cancers, 11 had prediagnostic CT scans taken in the 6 months before GC diagnosis. GRAPE suggested GC in 63.64% (7 of 11) patients in the 6 months before their diagnosis. d, A patient underwent 2 abdominal CT examinations at 14 and 6 months before diagnosis of GC due to pulmonary nodules, with no notable abnormalities of stomach reported in 2023. Later, this patient was diagnosed with poorly differentiated GC in T4aN1M0 stage via gastroscopy after more than 4 months of abdominal discomfort in April 2024. We evaluated the noncontrast CT before and at the time of diagnosis, and the results showed that the GRAPE indicated GC in noncontrast CT 6 months before diagnoses. Based on the GRAPE prediction and retrospective review of the image, the MDT suspected the patient was in stage T2, which was detected successfully by GRAPE 6 months in advance.
Extended Data Fig. 1
Extended Data Fig. 1. The GRAPE model and its interpretability analysis.
a. Model workflow and architecture. The GRAPE model takes the input of a non-contrast CT scan and first segment the stomach with a U-Net to obtain the ROI of the stomach region. It then processes the ROI region with a joint segmentation and classification network which extracts the multi-level feature of a U-Net backbone and perform classification after global pooling (GP) and fully connected layers (FC). b. Examples of interpretability analysis and three GC cases. The GRAPE model outputs the localization of the detected GC and aligns well with its heatmap visualization via the Grad-CAM approach.
Extended Data Fig. 2
Extended Data Fig. 2. ROC curves of individual centers.
The ROC curves show the performance of GRAPE in centers with more than 100 participants in the external validation cohort.
Extended Data Fig. 3
Extended Data Fig. 3. The performance of GRAPE in the internal and external cohorts.
a. The sensitivity, specificity and AUC of GRAPE in centers with more than 100 participants in the external validation cohort. b-e. The sensitivity of GRAPE in GC detection stratified by T stages and tumor locations. f. The sensitivity of GRAPE in GC detection in different status of stomach filing. g. The sensitivity of GRAPE in GC detection stratified by TNM stage. h. The sensitivity of GRAPE in GC detection in patients younger or older than 60. i. The sensitivity of GRAPE in GC detection stratified by sex. Subgroups with less than 10 samples were omitted.

References

    1. Smyth, E. C., Nilsson, M., Grabsch, H. I., van Grieken, N. C. & Lordick, F. Gastric cancer. Lancet396, 635–648 (2020). - PubMed
    1. Arnold, M. et al. Is gastric cancer becoming a rare disease? A global assessment of predicted incidence trends to 2035. Gut69, 823–829 (2020). - PMC - PubMed
    1. Lin, J.-L. et al. Global incidence and mortality trends of gastric cancer and predicted mortality of gastric cancer by 2035. BMC Public Health24, 1763 (2024). - PMC - PubMed
    1. Xia, J. Y. & Aadam, A. A. Advances in screening and detection of gastric cancer. J. Surg. Oncol.125, 1104–1109 (2022). - PMC - PubMed
    1. Jiang, Y. et al. Predicting peritoneal recurrence and disease-free survival from CT images in gastric cancer with multitask deep learning: a retrospective study. Lancet Digit Health4, e340–e350 (2022). - PubMed

Publication types

Associated data