. 2025 Jun 25;25(1):136.
doi: 10.1007/s10142-025-01648-4.

Exploring the m5C epitranscriptome of mRNAs in breast cancer cells through genome engineering and long-read sequencing approaches

Affiliations

Exploring the m5C epitranscriptome of mRNAs in breast cancer cells through genome engineering and long-read sequencing approaches

Konstantina Athanasopoulou et al. Funct Integr Genomics. .

Abstract

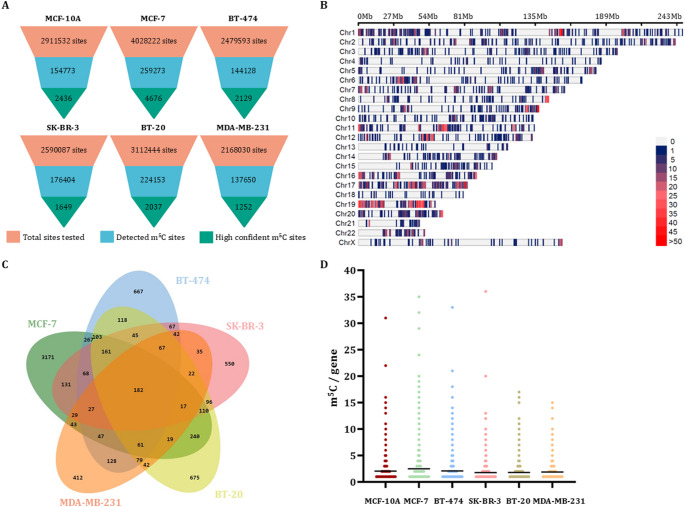
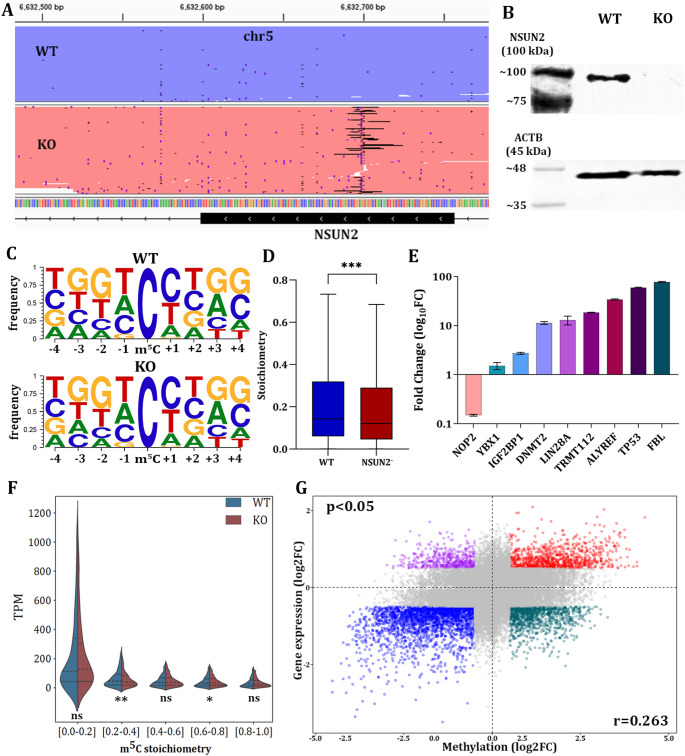
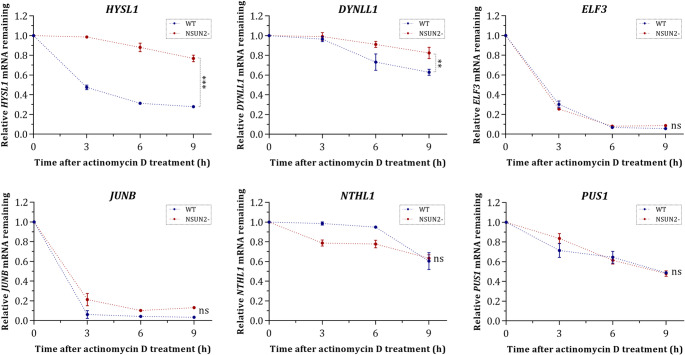
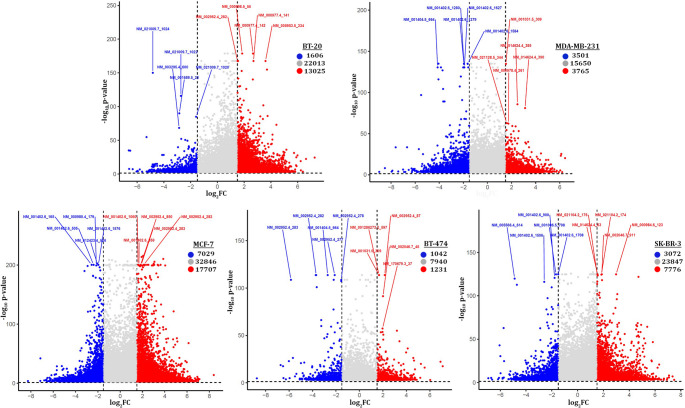
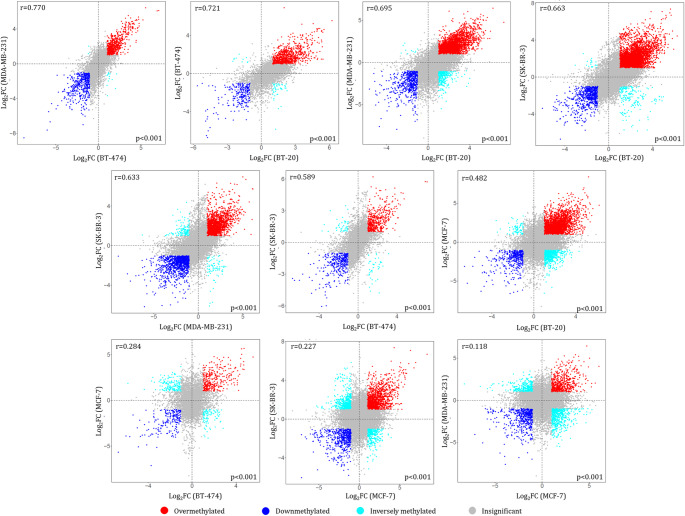
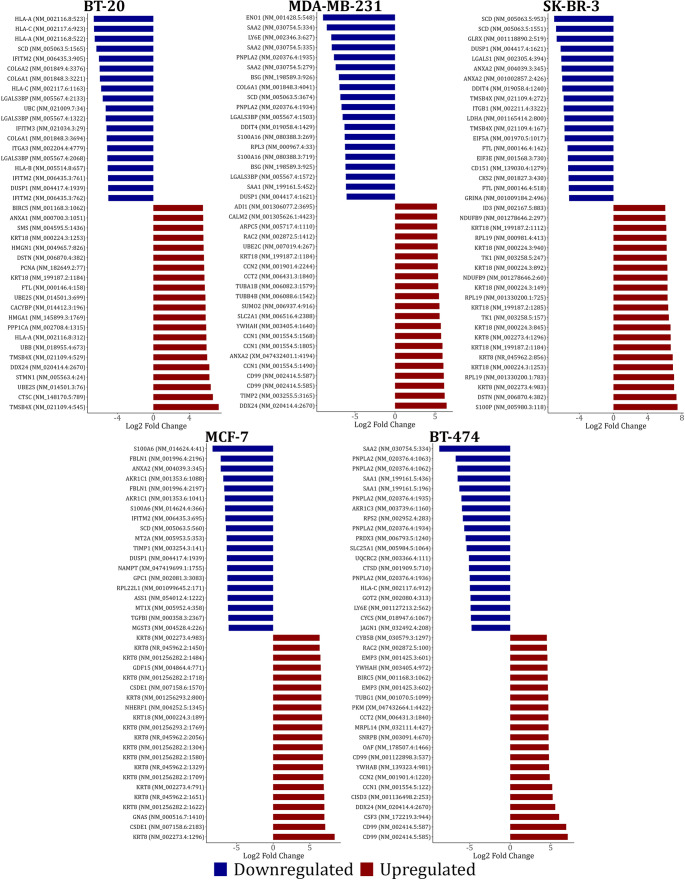
Epitranscriptomics has emerged as a rapidly evolving field that focused on studying post-transcriptional RNA modifications and their role in spatiotemporal regulation of gene expression. N6-methyladenosine (m6A) and 5-methylcytosine (m5C) represent the most extensively studied modifications on mRNAs. These reversible modifications, mediated by 'writer,' 'eraser,' and 'reader' proteins, dynamically fine-tune mRNA stability, splicing, and translation. Growing evidence links their dysregulation to pathological states, including cancer progression and metastasis, where their aberrant deposition on oncogenes or tumor suppressors alters cellular signaling and therapeutic responses. In the current study, we present a detailed analysis of the m5C epitranscriptomic landscape across distinct breast cancer molecular subtypes. Using CRISPR/Cas9, we confirm NSUN2 as a key m5C writer in human mRNAs. NSUN2 loss was validated by targeted sequencing and Western blotting. Furthermore, we demonstrate the regulatory effects of NSUN2 on its canonical mRNA targets, revealing its critical role in maintaining proper gene expression networks. Our findings strongly suggest that additional m5C writers contribute to m5C methylation machinery. Additionally, we assessed the functional impact of NSUN2 depletion on mRNAs harboring m5C sites using mRNA stability assays. Furthermore, our analysis revealed distinct m5C methylation patterns among breast cancer subtypes, highlighting unique m5C signatures associated with the disease. Notably, we identified specific hypomethylated and hypermethylated m5C sites in each breast cancer cell line, representing a universal m5C methylation signature for breast cancer. Our study constitutes the first comprehensive m5C epitranscriptomic atlas in human breast cancer and paves the way for future research aimed at developing targeted therapeutic interventions that leverage the m5C methylation landscape.

Keywords: 5-methylcytosine; Breast cancer; Epitranscriptomics; Gene expression; Nanopore sequencing; Post-transcriptional regulation; RNA biology; mRNA modifications.


Conflict of interest statement

Declarations. Ethics approval and consent to participate: Not applicable. Competing interests: The authors declare no competing interests. Clinical trial number: Not applicable.

Figures

Fig. 1
Fig. 1
Descriptive analysis of the nanopore sequencing data generated from the diverse panel of breast cell lines representing all major molecular subtypes of breast cancer (MCF-7 and BT-474 for luminal breast cancer, SK-BR-3 for HER2 + breast cancer, BT-20 and MDA-MB-231 for TNBC) as well as the non-malignant MCF-10 A breast cells. (A) Funnel plot of the m5C sites that were investigated in the breast cell lines. Light red color is used to present the total number of cytosine sites that have been tested for m5C methylation with CHEUI in each cell line. Light blue corresponds to the percentage of the identified m5C sites, while green is used for the highly confident sites (probability > 0.9999). (B) Genomic distribution of the highly confident (probability > 0.9999) m5C sites that reside within human mRNAs. The horizontal axis represents the chromosome length in Mb. Different colors correspond to the number of m5C methylation within a 27 Mb window size. (C) Venn diagram representing the number of unique and common highly confident (probability > 0.9999) m5C-methylated genes among the five breast cancer cell lines. (D) Demonstration of the number of m5C sites per gene. Black horizontal lines show the median value of m5C sites per gene in each cell line
Fig. 2
Fig. 2
Distribution of the highly confident (probability > 0.9999) m5C sites on human mRNAs and presentation of the m5C-related motifs. (A) Metaplot illustrating the relative abundance of m5C sites within the individual regions of mRNA transcripts (UTR: untranslated region, CDS: protein-coding region). (B) Correlation between the detected m5C sites and their distance from mRNA splice junctions. (C) Heatmap showing the relative abundance (%) of each motif harboring highly confident m5C sites. The m5C nucleotide is at the beginning of each presented motif
Fig. 3
Fig. 3
Assessment of NSUN2 knockout, evaluation of its motif-dependencies, investigation of its canonical target expression and m5C methylation status analysis. (A) IGV visualization of aligned NGS reads from WT and KO breast cells, demonstrating the efficiency of the knockout. The genomic region that is shown is equal to 312 bp, which is the amplicon size that was sequenced. For visual purposes, aligned reads from WT and KO cells are shown in blue and red color, respectively. (B) Western blot results for NSUN2 and ACTB expression in both WT and KO cells. (C) Motifplots for both WT and KO cells presenting all the 9mer-based motifs detected by CHEUI, centered at the highly confident m5C site. The sequence content is displayed as a pictogram. For each cell line the letter height is proportional to the frequency of the corresponding nucleotide at the given position. For each position bases are listed in descending order of frequency from top to bottom. (D) Boxplot depicting the differences in m5C stoichiometries of the highly confident sites between the WT and NSUN2- cells. P-value is shown with three asterisks (***) and corresponds to the significance level. (p-value < 0.001). (E) Graphical representation of the fold change values corresponding to the relative expression of the canonical NSUN2 targets in WT cells as compared to KO cells. Relative gene expression was assessed by qPCR using the 2−ΔΔCt method and GAPDH as housekeeping gene. qPCR experiments and downstream analysis were carried out using three technical replicates. (F) Half-violin plots showing the association of TPM values and m5C stoichiometry for both WT and KO conditions. Mann-Whitney U test was performed to assess the significance of TPM differences between WT and KO in each stoichiometry group. The symbol “*” is used to highlight a significance level of p-value < 0.05, “**” corresponds to a significance level of p-value < 0.01, while “ns” is used to denote non-significant differences. (G) Association of m5C methylation levels with overall gene expression levels. Red indicates hypermethylated sites within overexpressed transcripts, while blue represents hypomethylated sites within underexpressed transcripts. Purple highlights hypomethylated sites within overexpressed transcripts, and green corresponds to hypermethylated sites within underexpressed transcripts
Fig. 4
Fig. 4
Graphical representation of NSUN2 loss effect on mRNA stability after treatment of WT and KO cells with actinomycin D. Data was normalized using the 2−ΔΔCt method and GAPDH as internal reference gene. Remaining mRNA levels following actinomycin D treatment were calculated relative to timepoint 0 across the indicated timepoints, with error bars representing standard deviation from three biological replicates. The symbol “*” is used to highlight a significance level of p-value < 0.05, whereas “ns” is used for non-significant differences between the two investigated conditions
Fig. 5
Fig. 5
Schematic demonstration of the differentially methylated m5C sites between each cancerous cell line and the non-cancerous MCF-10 A cells. The GenBank® transcript ID and transcriptomic coordinates of the 5 most significant hyper- and hypomethylated m5C sites are also shown for each breast cancer cell line
Fig. 6
Fig. 6
Pairwise scatterplot matrix showing differential methylation of transcriptomic sites in breast cancer cell lines according to log2-fold change (Log2FC) values relative to non-cancerous MCF-10 A cells. Positive correlations between the investigated cell lines are shown in red, negative correlations in blue, whereas the inversely methylated m5C points are colored in cyan. The correlation was calculated by the Pearson coefficient with a p-value < 0.01
Fig. 7
Fig. 7
Reverse barplots highlighting the 20 most hypo- and hypermethylated m5C sites that were detected in each breast cancer molecular subtype relative to the non-cancerous MCF-10 A cell line. Blue and red bars represent hypo- and hypermethylated m5C transcriptomic sites, respectively

Similar articles

References

    1. Acera Mateos P, Ravindran AJS, Srivastava A, Woodward A, Mahmud K, Kanchi S, Guarnacci M, Xu M, Z J, Zhou WSY, Sneddon Y, Hamilton A, Gao W, Hayashi JLMS, Wickramasinghe R, Zarnack V, Preiss K, Burgio T, Dehorter G, Eyras NNES E (2024) Prediction of m6A and m5C at single-molecule resolution reveals a transcriptome-wide co-occurrence of RNA modifications. Nat Commun 15:3899. 10.1038/s41467-024-47953-7 - PMC - PubMed
    1. Boo SH, Kim YK (2020) The emerging role of RNA modifications in the regulation of mRNA stability. Exp Mol Med 52:400–408. 10.1038/s12276-020-0407-z - PMC - PubMed
    1. Chen YS, Yang WL, Zhao YL, Yang YG (2021) Dynamic transcriptomic m(5) C and its regulatory role in RNA processing. Wiley Interdiscip Rev RNA 12:e1639. 10.1002/wrna.1639 - PubMed
    1. Chen SJ, Zhang J, Zhou T, Rao SS, Li Q, Xiao LY, Wei ST, Zhang HF (2024) Epigenetically upregulated NSUN2 confers ferroptosis resistance in endometrial cancer via m(5)C modification of SLC7A11 mRNA. Redox Biol 69:102975. 10.1016/j.redox.2023.102975 - PMC - PubMed
    1. Cui Y, Lv P, Zhang C (2024) NSUN6 mediates 5-methylcytosine modification of METTL3 and promotes colon adenocarcinoma progression. J Biochem Mol Toxicol 38:e23749. 10.1002/jbt.23749 - PubMed

LinkOut - more resources