. 2025 Aug;9(8):1499-1511.
doi: 10.1038/s41559-025-02746-z. Epub 2025 Jun 24.

Threat reduction must be coupled with targeted recovery programmes to conserve global bird diversity

Affiliations

Threat reduction must be coupled with targeted recovery programmes to conserve global bird diversity

Kerry Stewart et al. Nat Ecol Evol. 2025 Aug.

Abstract

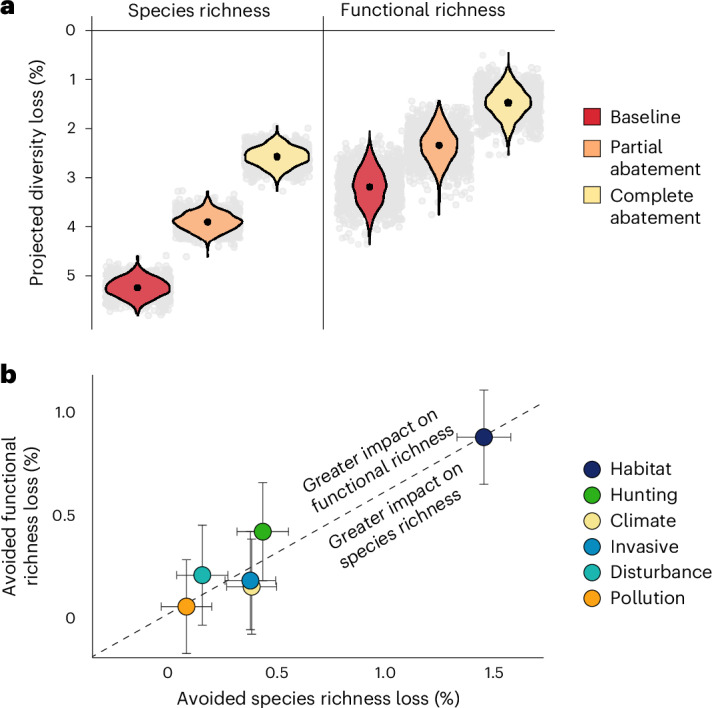
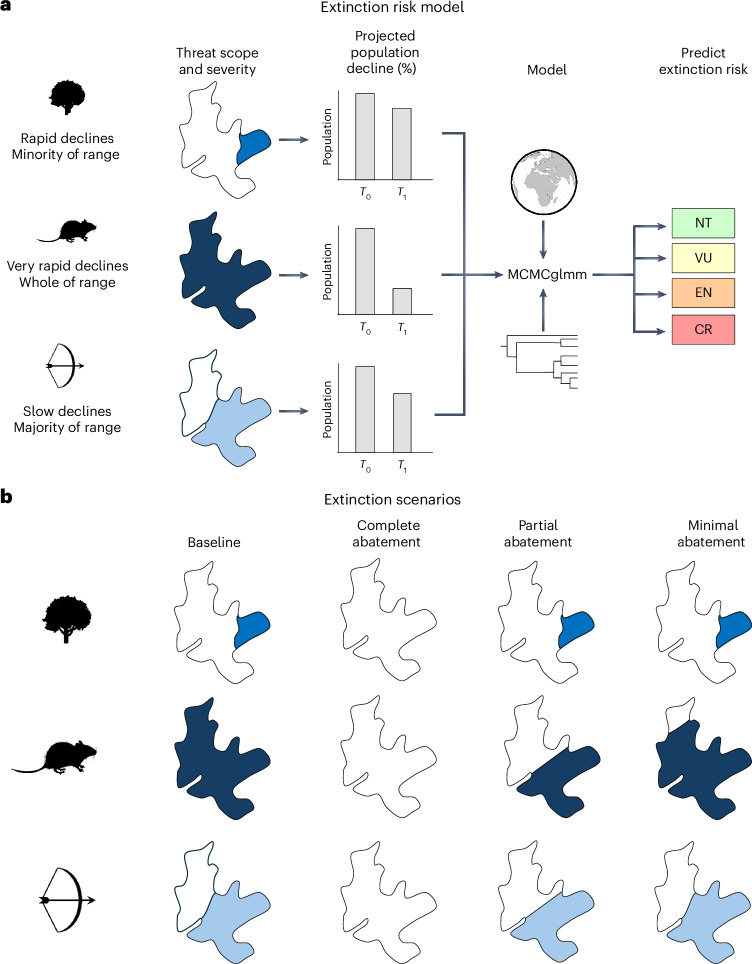
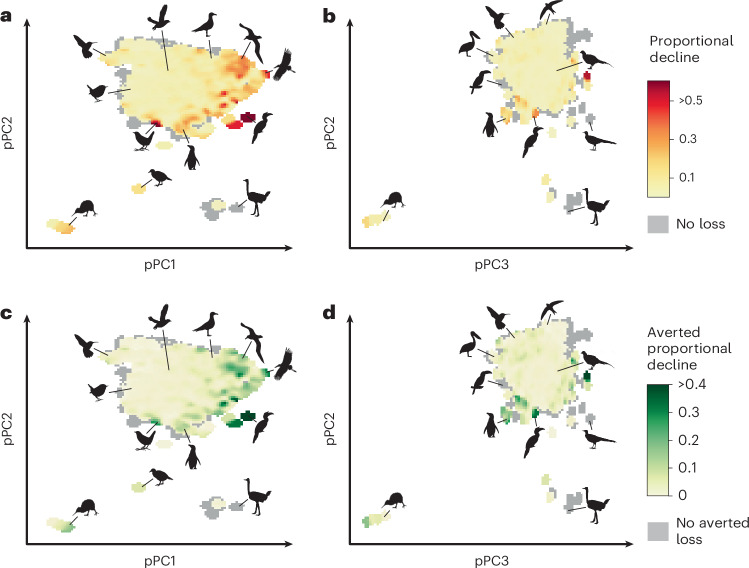
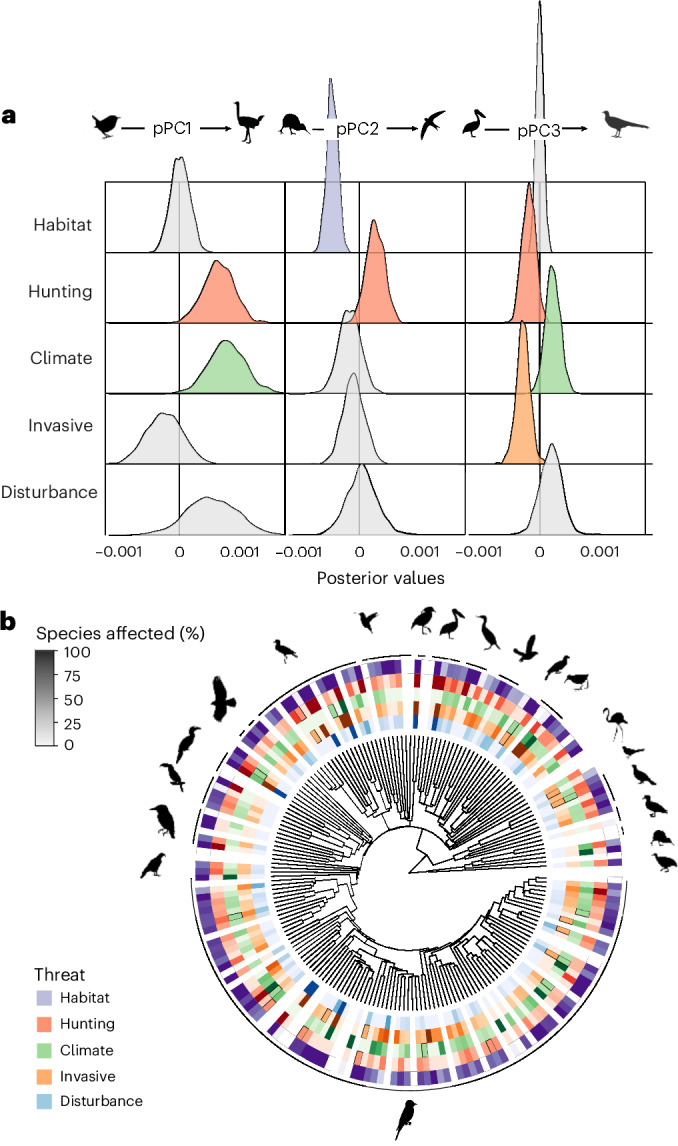
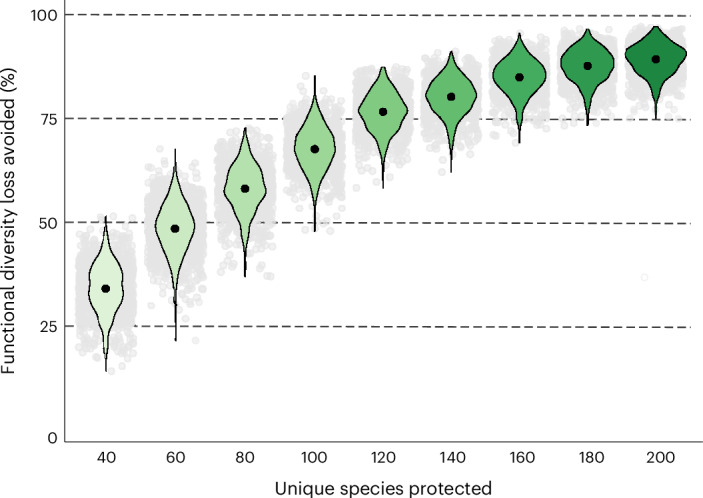
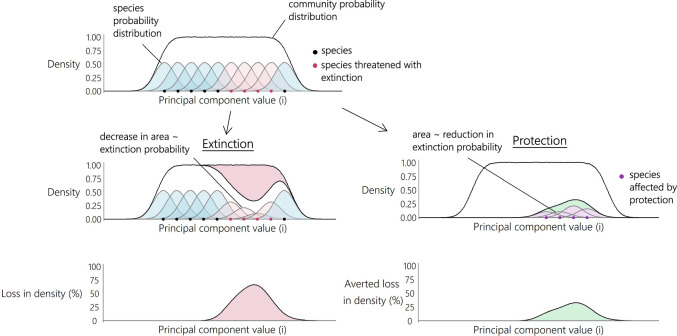
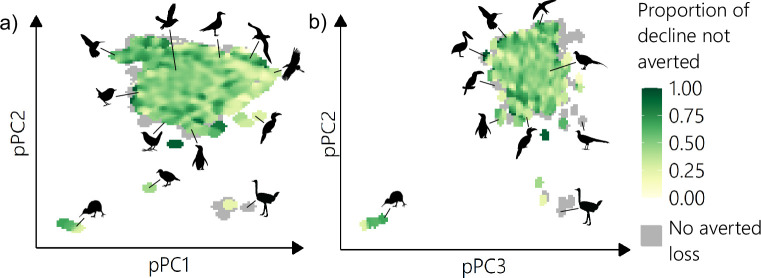
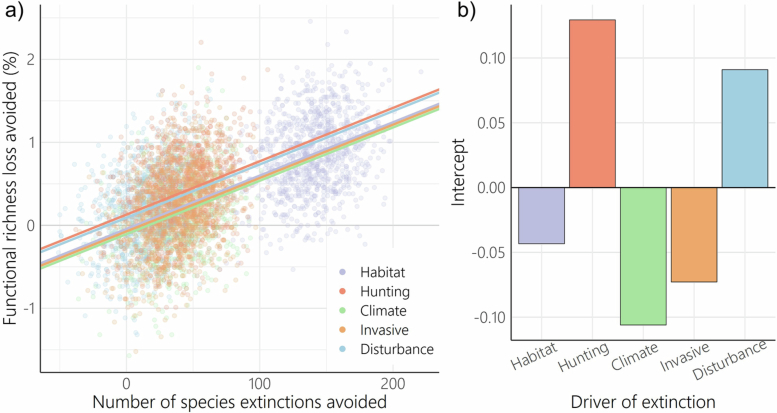
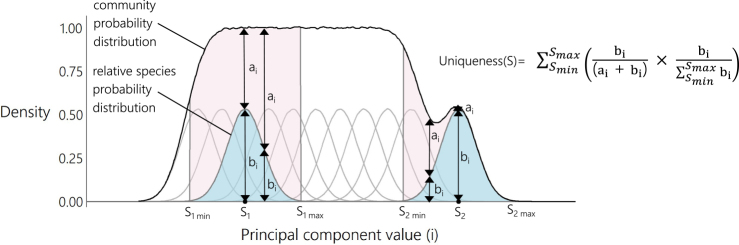
Ambitious international commitments have been made to preserve biodiversity, with the goal of preventing extinctions and maintaining ecosystem resilience, yet the efficacy of large-scale protection for preventing near-term extinctions remains unclear. Here, we used a trait-based approach to show that global actions-such as the immediate abatement of all threats across at least half of species ranges for ~10,000 bird species-will only prevent half of the projected species extinctions and functional diversity loss attributable to current and future threats in the next 100 years. Nonetheless, targeted recovery programmes prioritizing the protection of the 100 most functionally unique threatened birds could avoid 68% of projected functional diversity loss. Actions targeting 'habitat loss and degradation' will prevent the greatest number of species extinctions and proportion of functional diversity loss relative to other drivers of extinction, whereas control of 'hunting and collection' and 'disturbance and accidental mortality' would save fewer species but disproportionately boost functional richness. These findings show that conservation of avian diversity requires action partitioned across all drivers of decline and highlight the importance of understanding and mitigating the ecological impacts of species extinctions that are predicted to occur even under optimistic levels of conservation action.


Conflict of interest statement

Competing interests: The authors declare no competing interests.

Figures

Fig. 1
Fig. 1. Projected loss of avian diversity in the next 100 years.
a, Loss in species richness and functional richness under three scenarios: baseline extinction, partial abatement of all drivers of extinction and complete abatement of all drivers of extinction. Black points show mean loss across 1,000 iterations for each scenario, with variation in those points shown by their distribution (violin plots) and the individual values (grey dots). b, Diversity loss avoided under driver-specific complete abatement of six major drivers of extinction (circles represent the mean; error bars, 0.5 s.d.). Note that in some iterations, loss avoided could be negative, as more diversity was lost with driver-specific abatement than under the baseline scenario. The dotted diagonal line shows mean functional richness loss per species richness loss under complete abatement of all threats. Drivers above this line show greater avoidance of functional richness loss per species richness loss avoided relative to the mean across all drivers of extinction. Hunting, hunting and collection; climate, climate change and severe weather; invasive, invasive species, genes and disease; disturbance, disturbance and accidental mortality. Analyses based on 9,873 species (of which 2,087 species currently listed as Near Threatened or in threatened categories were modelled and could have reduced extinction risk in the abatement scenarios). A total of 1,000 iterations were run for each extinction scenario.
Fig. 2
Fig. 2. The extinction risk model and extinction scenarios.
a, IUCN Red List data on threat scope and severity were used to assign projected population decline over a 10-year period or three generations, according to previous publications,. Data on projected population decline for all species and all threats were used in an MCMCglmm to predict IUCN extinction risk category, using phylogenetic and spatial variables as random effects. NT, Near Threatened; VU, Vulnerable; EN, Endangered; CR, Critically Endangered. b, Four extinction scenarios were used: baseline, in which current, future and likely-to-return threats remained as listed by the IUCN; complete abatement, in which threats were removed across the entirety of the species range; partial abatement, in which threats were removed from at least 50% of the species range; and minimal abatement, in which threats were removed from at least 10% of the species range. Rattus fuscipes (Rachel T Mason, CC0 1.0) and Quercus robur silhouettes from Phylopic. Globe silhouette from ClipSafari (Sev, CC0 1.0).
Fig. 3
Fig. 3. Change in occupation of morphospace under extinction and conservation.
pPC1 is a descriptor of body size, pPC2 is associated with wing morphology and pPC3 is associated with beak and tail morphology (for trait loadings, see Supplementary Table 3). a,b, Predicted proportional decline in functional trait space occupation in the next 100 years under the baseline extinction scenario with respect to pPC1 and pPC2 (a) and pPC3 and pPC2 (b). c,d, Averted proportional decline under the complete abatement scenario for pPC1 and pPC2 (c) and pPC2 and pPC3 (d). In all panels, grey colour shows areas where no functional diversity loss was projected or where no functional diversity loss was avoided under complete abatement (fewer than five pixels in all panels). Analyses based on 9,873 species (of which 2,087 species currently listed as Near Threatened or in threatened categories were modelled and could have reduced extinction risk in the abatement scenarios). A total of 1,000 iterations were run for each extinction scenario. All silhouettes are from Phylopic. In a and c (left to right): Apteryx (Ferran Sayol, CC0 1.0), Mellisuga helenae (Steven Traver, CC0 1.0), Troglodytes hiemalis (Andy Wilson, CC0 1.0), Pteroptochos castaneus (Ferran Sayol, CCO 1.0), Atlantisia rogersi (there was no silhouette of A. rogersi so a silhouette of Gallirallus australis was used instead; T. Michael Keesey and HuttyMcphoo, CC BY-SA 3.0), Pelecanoides urinatrix (Louis Ranjard, CC BY 3.0), Spheniscus humboldti (Juan Carlos Jerí, CC0 1.0), Larus (Ferran Sayol, CC0 1.0), Diomedeidae (Ferran Sayol, CC0 1.0), Struthio camelus (Darren Naish and T. Michael Keesey, CC BY 3.0), Buceros (Ferran Sayol, CC0 1.0) and Leptoptilos javanicus (T. Michael Keesey and Vaibhavcho, CC BY-SA 3.0). In b and d (left to right): Apteryx (Ferran Sayol, CC0 1.0), Pelecanus (Ferran Sayol, CC0 1.0), Ramphastidae (Federico Degrange, CC0 1.0), S. humboldti (Juan Carlos Jerí, CC0 1.0), M. helenae (Steven Traver, CC0 1.0), Buceros (Ferran Sayol, CC0 1.0), Apus apus (Ferran Sayol, CC0 1.0), Phasianus colchicus (Mattia Menchetti, CC0 1.0), Menura (T. Michael Keesey, CC0 1.0) and S. camelus (Darren Naish and T. Michael Keesey, CC BY 3.0).
Fig. 4
Fig. 4. Drivers of extinction vary across morphospace and the avian tree of life.
a, Posterior values from a multi-response MCMCglmm showing the relationships between pPC values and the frequency (from 1,000 iterations across 9,873 species) in which extinction was avoided under driver-specific complete abatement scenarios. pPC1 is a descriptor of body size, pPC2 is associated with wing morphology and pPC3 is associated with beak and tail morphology (Supplementary Table 3). Least Concern species were not included in the extinction risk model, as improvements under driver-specific complete abatement could not occur by definition. b, Distribution of drivers of extinction with respect to phylogeny, shown by family (9,873 species across 194 families, of which threat information was included for 2,087 Near Threatened and threatened species), with the intensity of colour reflecting the proportion of species in a family affected by each driver (families including only Least Concern or Data Deficient species are shaded white). All silhouettes are from Phylopic. In a (left to right): T. hiemalis (Andy Wilson, CC0 1.0), S. camelus (Darren Naish and T. Michael Keesey, CC BY 3.0), Apteryx (Ferran Sayol, CC0 1.0), A. apus (Ferran Sayol, CC0 1.0), Pelecanus (Ferran Sayol, CC0 1.0), Menura (T. Michael Keesey, CC0 1.0). In b (left to right): Falconiformes (Kai Caspar, CC0 1.0), Coraciiformes (Estelle Bourdon, CC0 1.0), Piciformes (Federico Degrange, CC0 1.0), Bucerotiformes (Ferran Sayol, CC0 1.0), Charadriiformes (Auckland Museum, CC BY 3.0), Apodiformes (Andy Wilson, CC0 1.0), Passeriformes (Andy Wilson, CC0 1.0), Eurypygiformes (Ferran Sayol, CC0 1.0), Pelecaniformes (Ferran Sayol, CC0 1.0), Suliformes (Juan Carlos Jerí, CC0 1.0), Procellariiformes (Louis Ranjard, CC BY 3.0), Musophagiformes (Ferran Sayol, CC0 1.0), Gruiformes (Ferran Sayol, CC0 1.0), Phoenicopteriformes (T. Michael Keesey, PDM 1.0), Mesitornithiformes (Ferran Sayol, CC0 1.0), Galliformes (Elisabeth Östman, PDM 1.0), Anseriformes (Rebecca Groom, CC BY 3.0), Apterygiformes (Ferran Sayol, CC0 1.0) and Tinamiformes (Darren Naish and T. Michael Keesey, CC BY 3.0).
Fig. 5
Fig. 5. Preventing extinction of unique threatened species reduced projected functional diversity loss.
Functional diversity loss avoided (as a percentage of projected functional diversity loss under the baseline scenario) from 1,000 iterations. Black points show mean loss avoided; violin plots show the distribution; grey points show individual values of loss avoided under each iteration. The number of unique threatened species that were prevented from going extinct (‘protected’) varied between 40 and 200 unique threatened species at intervals of 20 species.
Extended Data Fig. 1
Extended Data Fig. 1. Variance explained by phylogenetic principal components (pPC).
Red dotted line indicates elbow after which adding additional phylogenetic principal components would explain little additional variance (n=9873 species).
Extended Data Fig. 2
Extended Data Fig. 2. Occupation of morphospace in extant birds.
Shown on 2-dimensional plane with respect to a, pPC1 and pPC2, and b, pPC2 and pPC3 with trait loadings (also see Supplementary Table 3). BD = beak depth, BLC = beak length (culmen), BLN = beak length (nares), BW =beak width, HWI = hand-wing index, KD = Kipp’s distance, LL = tarsus length, M = body mass, S = first secondary length, TL = tail length, WL = wing length (n=9873 species). All silhouettes from Phylopic. Panel a left to right: Apteryx (Ferran Sayol, CC0 1.0), Mellisuga helenae (Steven Traver, CC0 1.0), Troglodytes hiemalis (Andy Wilson, CC0 1.0), Pteroptochos castaneus (Ferran Sayol, CCO 1.0), Pelecanoides urinatrix (Louis Ranjard, CC BY 3.0), Gallirallus australis (there was no silhouette of Atlantsia rogersi so a silhouette of Gallirallus australis was used instead, T. Michael Keesey, CC BY-SA 3.0), Spheniscus humboldti (Juan Carlos Jerí, CC0 1.0), Larus (Ferran Sayol, CC0 1.0), Diomedeidae (Ferran Sayol, CC0 1.0), Struthio camelus (Darren Naish and T. Michael Keesey, CC BY 3.0), Buceros (Ferran Sayol, CC0 1.0), Leptoptilos javanicus (T. Michael Keesey, CC BY-SA 3.0). Panel b left to right: Apteryx (Ferran Sayol, CC0 1.0), Pelecanus (Ferran Sayol, CC0 1.0), Ramphastidae (FJDegrange, CC0 1.0), Spheniscus humboldti (Juan Carlos Jerí, CC0 1.0), Mellisuga helenae (Steven Traver, CC0 1.0), Buceros (Ferran Sayol, CC0 1.0), Apus apus (Ferran Sayol, CC0 1.0), Struthio camelus (Darren Naish and T. Michael Keesey, CC BY 3.0), Phasianus colchicus (Mattia Menchetti, CC0 1.0), Menura (T. Michael Keesey, CC0 1.0).
Extended Data Fig. 3
Extended Data Fig. 3. Estimating functional richness loss.
When species removal is biased with respect to species traits (principal component values) functional richness loss is greater. Shown in one dimension for simplicity, functional richness was calculated in three-dimensional trait space composed of the first three phylogenetic principal components.
Extended Data Fig. 4
Extended Data Fig. 4. Estimating change in density in morphospace under extinction and conservation.
Loss in density of morphospace was calculated using the baseline extinction scenario, and averted loss in density of morphospace was calculated using the complete abatement scenario.
Extended Data Fig. 5
Extended Data Fig. 5. Proportion of decline in density of morphospace occupation that was not averted by complete abatement.
Plotted for a) pPC1 and pPC2, and b) pPC2 and pPC3. Grey shows areas where no functional diversity loss was projected, or where no functional diversity loss was avoided under complete abatement (only three pixels in panel a and two pixels in panel b). Analyses based on 9873 species (of which 2087 species currently listed as Near Threatened or in threatened categories were modelled and could have reduced extinction risk in the abatement scenarios). 1000 iterations were run for each extinction scenario. All silhouettes from Phylopic. Panel a left to right: Apteryx (Ferran Sayol, CC0 1.0), Mellisuga helenae (Steven Traver, CC0 1.0), Troglodytes hiemalis (Andy Wilson, CC0 1.0), Pteroptochos castaneus (Ferran Sayol, CCO 1.0), Atlantisia rogersi (there was no silhouette of Atlantsia rogersi so a silhouette of Gallirallus australis was used instead, T. Michael Keesey and HuttyMcphoo, CC BY-SA 3.0), Pelecanoides urinatrix (Louis Ranjard, CC BY 3.0), Spheniscus humboldti (Juan Carlos Jerí, CC0 1.0), Larus (Ferran Sayol, CC0 1.0), Diomedeidae (Ferran Sayol, CC0 1.0), Struthio camelus (Darren Naish and T. Michael Keesey, CC BY 3.0), Buceros (Ferran Sayol, CC0 1.0), Leptoptilos javanicus (T. Michael Keesey and Vaibhavcho, CC BY-SA 3.0). Panel b left to right: Apteryx (Ferran Sayol, CC0 1.0), Pelecanus (Ferran Sayol, CC0 1.0), Ramphastidae (Federico Degrange, CC0 1.0), Spheniscus humboldti (Juan Carlos Jerí, CC0 1.0), Mellisuga helenae (Steven Traver, CC0 1.0), Buceros (Ferran Sayol, CC0 1.0), Apus apus (Ferran Sayol, CC0 1.0), Phasianus colchicus (Mattia Menchetti, CC0 1.0), Menura (T. Michael Keesey, CC0 1.0), Struthio camelus (Darren Naish and T. Michael Keesey, CC BY 3.0).
Extended Data Fig. 6
Extended Data Fig. 6. Abatement of hunting and collection, and disturbance and accidental mortality provides disproportionate benefits for functional richness.
a, Number of species extinctions avoided under driver-specific complete abatement against functional richness loss avoided (% of functional richness of full assemblage) as described by a linear mixed effects model including number of species extinctions avoided and driver of extinction as fixed effects, and iteration number as a random effect. b, Intercepts of linear mixed effect model of number of species extinctions avoided against functional richness loss for each driver of extinction showing the proportional impact of each direct driver of extinction given the number of species extinctions. Habitat = habitat loss and degradation, Hunting = hunting and collection, Climate= climate change and severe weather, Invasive = invasive species and disease, Disturbance = disturbance and accidental mortality. Pollution was not included as it made a negligible contribution to functional richness loss (see Extended Data Table 3) (n = 5000, 1000 iterations for each extinction scenario).
Extended Data Fig. 7
Extended Data Fig. 7. Functional uniqueness calculation.
Functional uniqueness describes the proportion of the community probability distribution that was composed of the species probability distribution. Proportions were summed across cells in which the species probability distribution was greater than 0, with a weight proportional to the probability of species occurrence in that cell, indicated by the height of the species probability distribution.

Similar articles

Cited by

References

    1. Rockström, J. et al. A safe operating space for humanity. Nature461, 472–475 (2009). - PubMed
    1. Richardson, K. et al. Earth beyond six of nine planetary boundaries. Sci. Adv.9, eadh2458 (2023). - PMC - PubMed
    1. Purvis, A. et al. Status and trends—nature. In The Global Assessment Report on Biodiversity and Ecosystem Services (eds Brondízio, E. S. et al.) Chapter 2.2 (IPBES Secretariat, 2019); 10.5281/zenodo.5517457
    1. Cadotte, M. W., Carscadden, K. & Mirotchnick, N. Beyond species: functional diversity and the maintenance of ecological processes and services. J. Appl. Ecol.48, 1079–1087 (2011).
    1. Tilman, D. et al. The influence of functional diversity and composition on ecosystem processes. Science277, 1300–1302 (1997).

LinkOut - more resources