. 2025 Jul;32(7):2404-2422.
doi: 10.1007/s43032-025-01917-4. Epub 2025 Jun 24.

Transcriptomic Profiling Reveals Potential Genes Involved in the Immune Landscape of Polycystic Ovary Syndrome: An Exploratory Study

Affiliations

Transcriptomic Profiling Reveals Potential Genes Involved in the Immune Landscape of Polycystic Ovary Syndrome: An Exploratory Study

Ye Zhang et al. Reprod Sci. 2025 Jul.

Abstract

Background: Polycystic ovary syndrome (PCOS) is a complex endocrine disorder associated with chronic inflammation, insulin resistance, and ovarian dysfunction. Emerging evidence implicates granulosa cell anoikis, a specialized form of apoptosis induced by extracellular matrix detachment, in PCOS pathogenesis. However, the involvement of anoikis-related genes (ARGs) remains poorly understood.

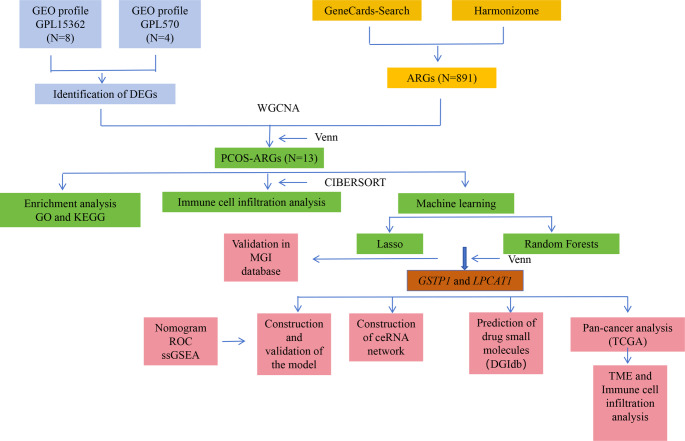
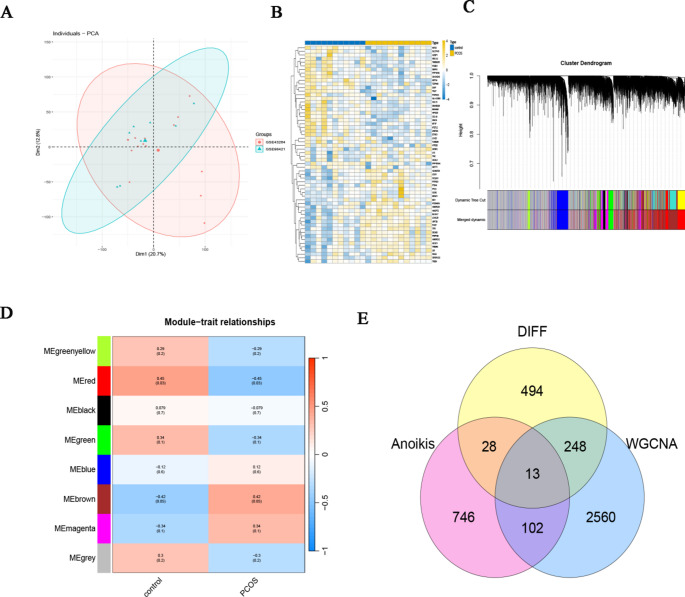
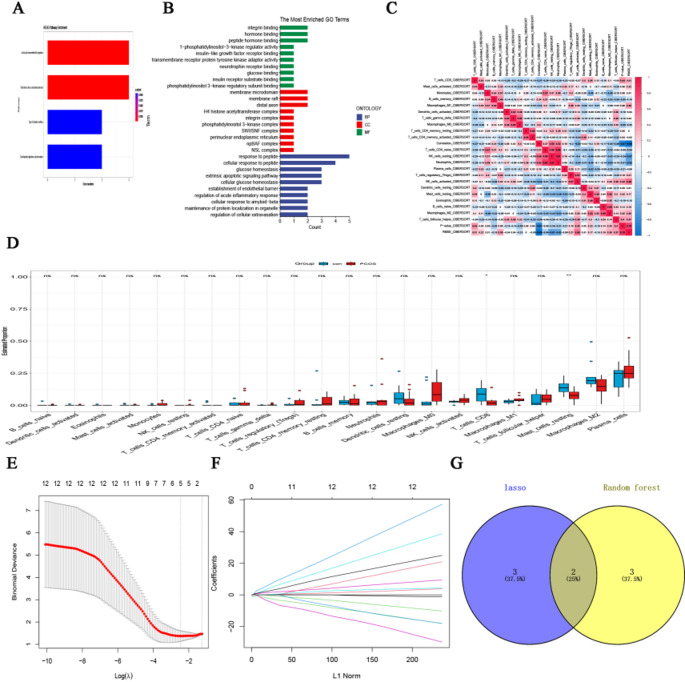
Methods: Transcriptomic data from two GEO datasets (GSE43264 and GSE98421) were integrated, followed by differential gene expression analysis and weighted gene co-expression network analysis (WGCNA). Thirteen differentially expressed ARGs (DEARGs) were identified. Functional enrichment (GO/KEGG), immune infiltration profiling (CIBERSORT), and machine learning models were used to screen for hub biomarkers. Diagnostic potential was validated using ROC and nomogram analyses. ceRNA, drug-gene, and transcription factor networks were constructed. Pancancer expression and immune relevance were assessed using TCGA, and gene function was validated through MGI.

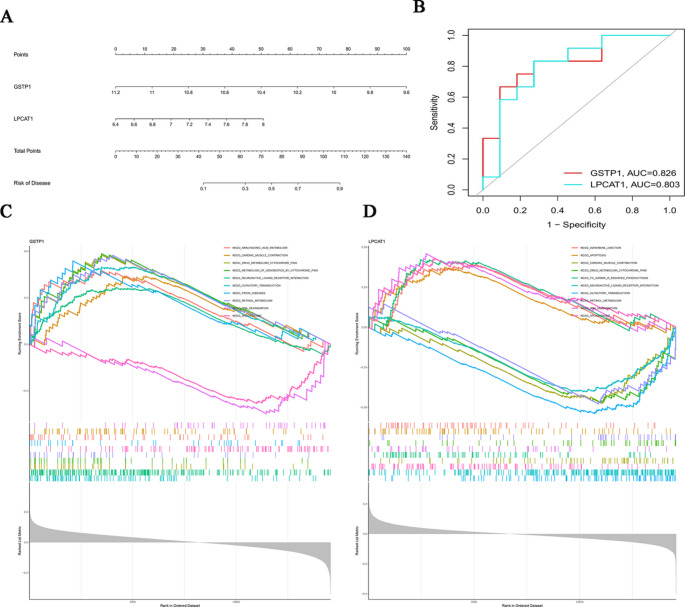
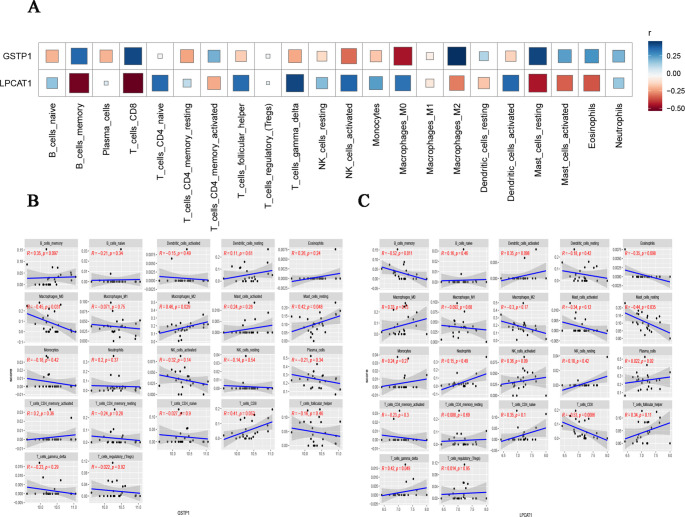
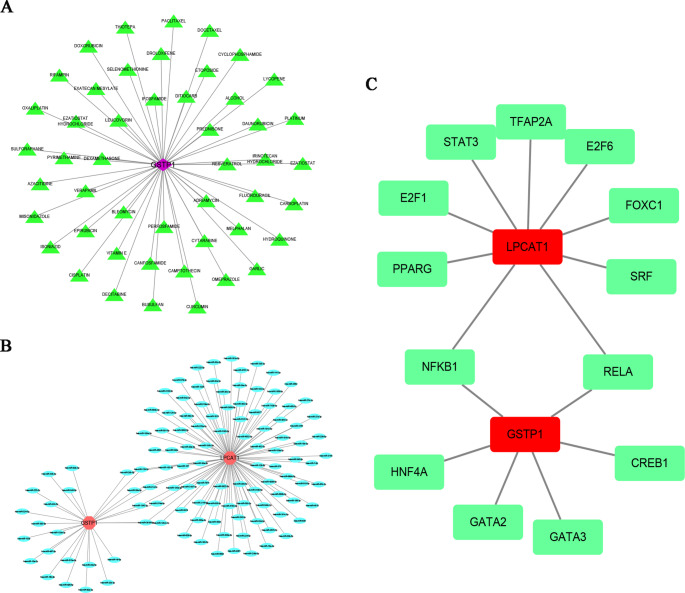
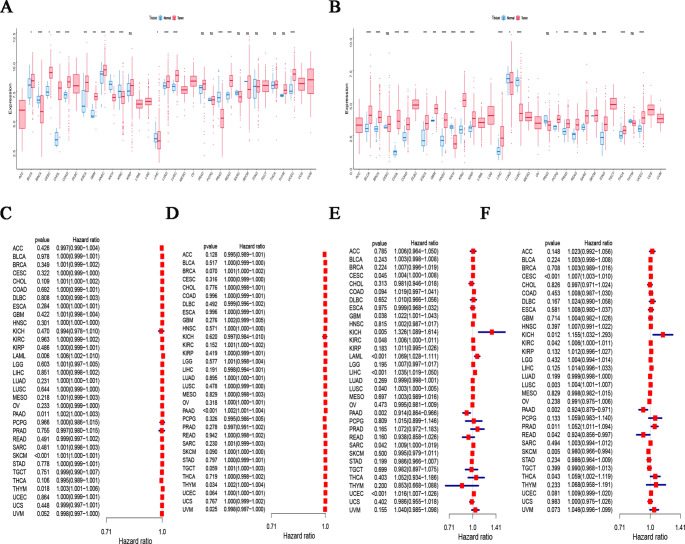
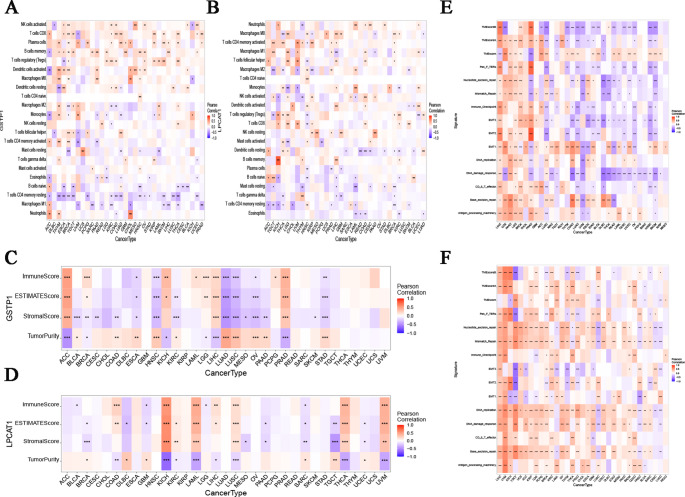
Results: Two ARGs, GSTP1 and LPCAT1, were identified as robust diagnostic markers (AUC > 0.80). These genes were significantly associated with immunosuppressive cell infiltration (e.g., elevated M2 macrophages, reduced CD8⁺ T cells). GSEA linked both genes to apoptosis, PI3K signaling, and immune pathways. MGI validation revealed that GSTP1 and LPCAT1 are involved in reproductive and metabolic regulation in murine models, supporting their functional relevance to PCOS. Drug prediction analyses identified resveratrol, curcumin, and vitamin E as potential therapeutics.

Conclusion: This is the first exploratory study to identify GSTP1 and LPCAT1 as potential diagnostic biomarkers for PCOS, validated across multi-omics platforms and functional databases. These findings highlight a novel anoikis-immunity axis in PCOS and suggest new directions for biomarker-guided therapy.

Supplementary Information: The online version contains supplementary material available at 10.1007/s43032-025-01917-4.

Keywords: Anoikis; Diagnostic biomarkers; Drug prediction; Immune landscape; Machine learning; Pancancer; Polycystic ovary syndrome.


Conflict of interest statement

Declarations. Ethics Approval and Consent to Participate: Not applicable. Consent for Pubilication: Not applicable. Conflict of Interest: The authors declare that they have no competing interests.

Figures

Fig. 1
Fig. 1
Study flow. Abbreviations: GEO (Gene Expression Omnibus), PCOS (Polycystic Ovary Syndrome), DEGs (Differential Expression Genes), WGCNA (Weighted Gene Co-expression Network Analysis), ARGs (Anoikis-Related Genes), MGI (Mouse Genome Informatics) database, GO (Gene Ontology), KEGG (Kyoto Encyclopedia of Genes and Genomes), ROC (Receiver Operating Characteristic), GSEA (Gene Set Enrichment Analysis), LASSO (Least Absolute Shrinkage and Selection Operator), TCGA (The Cancer Genome Atlas); TME (Tumor Microenvironment)
Fig. 2
Fig. 2
Identification of anoikis-related differentially expressed genes (DEGs) and co-expression modules. (A) Principal component analysis (PCA) showing the sample distribution and batch effect between the two datasets (GSE43264 and GSE98421). Each dot represents a sample; colors indicate dataset origin. (B) Heatmap of differentially expressed genes (DEGs) in polycystic ovary syndrome (PCOS) samples compared to controls. Yellow and blue represent high and low expression levels, respectively. (C) Cluster dendrogram of genes based on weighted gene co-expression network analysis (WGCNA). Each branch represents a gene, and color bars below indicate module membership. (D) Module-trait relationships between gene modules and PCOS/control groups. The color scale reflects correlation coefficients, with red indicating positive and blue indicating negative correlations. Each cell shows the correlation coefficient and p-value in parentheses. (E) Venn diagram showing overlap among DEGs (DIFF), anoikis-related genes (ARGs), and key module genes identified by WGCNA. The intersection of the three sets indicates potential ARGs associated with PCOS
Fig. 3
Fig. 3
Functional enrichment, immune infiltration analysis, and machine learning screening of ARGs in PCOS. (A) Kyoto Encyclopedia of Genes and Genomes (KEGG) pathway enrichment analysis of PCOS-related ARGs, showing the top enriched signaling pathways. (B) Gene Ontology (GO) enrichment analysis of PCOS-related ARGs, classified into biological process (BP), cellular component (CC), and molecular function (MF) categories. (C) Heatmap showing pairwise correlations among immune cell types in PCOS samples. Red and blue colors indicate positive and negative correlations, respectively; numeric values represent correlation coefficients. (D) Boxplots comparing the relative abundance of immune cell types between PCOS and control groups. Boxes show interquartile ranges, and whiskers indicate data variability. Statistical significance: P < 0.05 (*), P < 0.01 (**), ns = not significant. (E) LASSO logistic regression model used for feature selection of ARGs. The plot shows tenfold cross-validation results across different log(λ) values; the vertical dotted line marks the optimal λ with the minimum binomial deviance. (F) LASSO coefficient profiles of ARGs along the L1 regularization path. Five genes with non-zero coefficients were selected for further analysis. (G) Venn diagram showing the overlapping ARGs identified by both LASSO and Random Forest algorithms. The intersection indicates the common hub genes selected by both machine learning methods. Percentages represent the proportion of genes in each segment
Fig. 4
Fig. 4
Construction and validation of a predictive model based on hub ARGs in PCOS. (A) A nomogram model integrating the expression levels of GSTP1 and LPCAT1 to predict disease risk in PCOS patients. Points are assigned to each gene and summed to estimate the total risk score. (B) Receiver operating characteristic (ROC) curves evaluating the diagnostic performance of GSTP1 (AUC = 0.826) and LPCAT1 (AUC = 0.803) in distinguishing PCOS from control samples. (C) Single-sample gene set enrichment analysis (ssGSEA) of GSTP1, showing its association with multiple KEGG pathways. The plot ranks samples by expression level and highlights pathway enrichment scores. (D) ssGSEA results for LPCAT1, displaying pathway-level enrichment patterns across samples. Color-coded lines indicate different KEGG functional categories
Fig. 5
Fig. 5
Hub ARGs and immune cell infiltration correlation. (A) Heatmap illustrating the correlation coefficients between the expression of hub ARGs (GSTP1 and LPCAT1) and the infiltration levels of 22 immune cell types. Red and blue represent positive and negative correlations, respectively; color intensity indicates the strength of correlation. (B) Scatter plots showing Spearman correlation between GSTP1 expression and immune cell abundance. Each subplot represents a specific immune cell type. Black dots denote individual samples, blue lines show the fitted regression trend, and shaded areas represent the 95% confidence interval. Correlation coefficient (ρ) and P-value are shown in red. (C) Similar to (B), Spearman correlation between LPCAT1 expression and immune cell infiltration is shown. Statistically significant correlations (P < 0.05) are marked accordingly
Fig. 6
Fig. 6
Drug prediction and ceRNA network construction. (A) Drug–Gene Interaction Database (DGIdb) was used to predict drugs that interact with GSTP1. The network identified 48 drug-gene pairs. Purple shape represents GSTP1, while green shapes represent potential drugs. (B) Competing endogenous RNA (ceRNA) network based on hub genes GSTP1 and LPCAT1. The network shows predicted miRNA-mRNA interactions in PCOS. Red nodes indicate genes, and blue ellipses indicate miRNAs. (C)The transcription factor (TF)-gene co-regulatory network in PCOS interaction of TF with two hub genes. The red shapes represent genes, and the green shapes represent TFs
Fig. 7
Fig. 7
Pan-cancer analysis in PCOS with shared hub genes. (A) Analyzing the expression disparities of GSTP1 across 33 different types of cancers through the TCGA database. (B) Analyzing the expression disparities of LPCAT1 across 33 different types of cancers through the TCGA database. (C) A forest plot depicting GSTP1 hazard ratio along with its 95% confidence interval, encompassing overall survival (OS) rates for 33 distinct cancers were presented. (D) A forest plot depicting GSTP1 hazard ratio along with its 95% confidence interval, encompassing progression-free interval (PFI) rates for 33 distinct cancers were presented. (E) A forest plot depicting LPCAT1 hazard ratio along with its 95% confidence interval, encompassing overall survival (OS) rates for 33 distinct cancers were presented. (F) A forest plot depicting LPCAT1 hazard ratio along with its 95% confidence interval, encompassing progression-free interval (PFI) rates for 33 distinct cancers were presented. Note: The symbol in the figures * represents P < 0.05; ** represents P < 0.01; *** represents P < 0.001; **** represents P < 0.0001
Fig. 8
Fig. 8
Hub genes and their correlations with pan-cancer and immune cells. (A) Hierarchical clustering of the distribution of GSTP1 and the 22 immune cells with 33 different types of cancers. Colors indicate correlation strength (red = positive, blue = negative). (B) Hierarchical clustering of the distribution of LPCAT1 and the 22 immune cells with 33 different types of cancers. (C) Correlation analysis of immune cell infiltration immunophenoscores, stromal Scores, and estimation scores with GSTP1 across 33 different types of cancers samples. (D) Correlation analysis of immune cell infiltration immunophenoscores, stromal Scores, and estimation scores with LPCAT1 across 33 different types of cancers samples. (E) Hierarchical clustering of the associationssociation analysis of immune regulatory factors between GSTP1 expression and 33 different types of cancers samples. (F) Hierarchical clustering of the association analysis of immune regulatory factors between LPCAT1 expression and 33 different types of cancers samples. Note: The symbol in the figures * represents P < 0.05; ** represents P < 0.01; *** represents P < 0.001; **** represents P < 0.0001

Similar articles

References

    1. Stener-Victorin E, Teede H, Norman RJ, Legro R, Goodarzi MO, Dokras A, Laven J, Hoeger K, Piltonen TT. Polycystic ovary syndrome. Nat Rev Dis Primers. 2024;10(1):27. 10.1038/s41572-024-00511-3. PMID: 38637590. - PubMed
    1. Jafari K, Tajik N, Moini A, SeyedAlinaghi S, Abiri A. Metabolic mediators of the overweight’s effect on infertility in women with polycystic ovary syndrome. Sci Rep. 2025;15(1):16258. 10.1038/s41598-025-01287-6. PMID: 40346143; PMCID: PMC12064820. - PMC - PubMed
    1. Luan YY, Zhang L, Peng YQ, Li YY, Liu RX, Yin CH. Immune regulation in polycystic ovary syndrome. Clin Chim Acta. 2022;531:265–72. 10.1016/j.cca.2022.04.234. Epub 2022 Apr 18. PMID: 35447143. - PubMed
    1. Melin J, Forslund M, Alesi S, et al. Metformin and combined oral contraceptive pills in the management of polycystic ovary syndrome: A systematic review and meta-analysis. J Clin Endocrinol Metab. 2024;109(2):e817–36. 10.1210/clinem/dgad465. - PMC - PubMed
    1. Tong C, Wu Y, Zhang L, Yu Y. Insulin resistance, autophagy and apoptosis in patients with polycystic ovary syndrome: association with PI3K signaling pathway. Front Endocrinol (Lausanne). 2022;13:1091147. 10.3389/fendo.2022.1091147. PMID: 36589825; PMCID: PMC9800521. - PMC - PubMed

LinkOut - more resources