

FRRS1L variants and ferriheme overload drive hyperpigmentation and systemic Iron overload in lanping black bone sheep
- PMID: 40556005
- PMCID: PMC12188663
- DOI: 10.1186/s13578-025-01426-6
FRRS1L variants and ferriheme overload drive hyperpigmentation and systemic Iron overload in lanping black bone sheep
Abstract
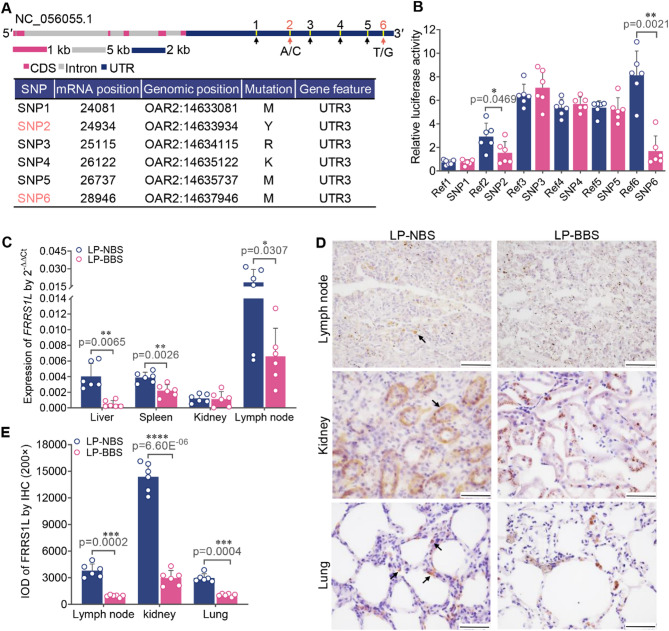
Background: Hemoglobin metabolism disorder can result in systemic iron overload, leading to pigmentation in multiple organs. Although these disorders are often of genetic origin, the specific genes and mechanisms remain incompletely understood. Lanping black bone sheep (LP–BBS), a unique population from the high altitudes along the Hengduan Mountains in Yunnan province, exhibits hyperpigmentation in multiple tissues. Investigating the genetic and environmental factors underlying this phenotype provides a natural model to better understand hemoglobin metabolism disorder.
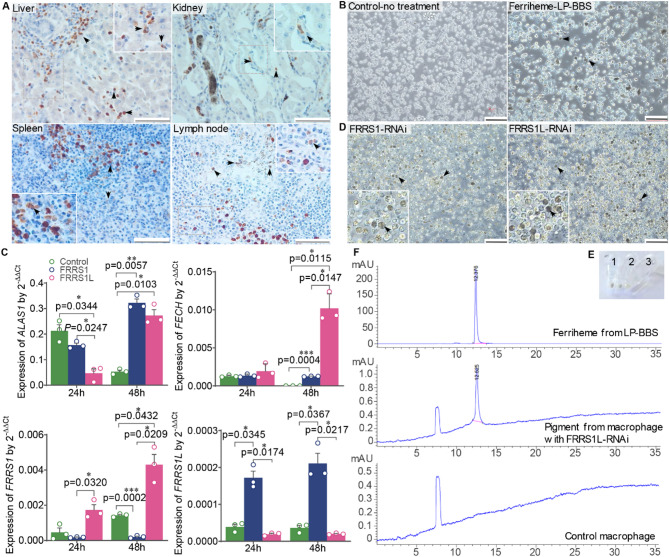
Results: LP-BBS were found to exhibit increased red blood cell counts, elevated hemoglobin levels, and systemic iron overload, evidenced by hyperpigmentation in various tissues. Histological and molecular analyses revealed that hyperpigmentation is driven by ferriheme overload, an inheritable quantitative trait influenced by both genetic variation and environmental factors. Genome-wide association studies identified FRRS1L as a candidate gene, with significant mutations in its 3′-untranslated region (3′-UTR) reducing FRRS1L expression. Functional assays demonstrated that insufficient FRRS1L expression promotes ferriheme accumulation in reticuloendothelial cells and macrophages, as confirmed in vitro using FRRS1L knockdown models. Ferriheme overload was associated with oxidative stress and systemic inflammation, causing pathological damage to critical organs such as the kidney, liver, and uterus.
Conclusion: This study identifies FRRS1L as a key contributor to ferriheme overload through aberrant hemoglobin metabolism in LP–BBS. These findings offer new insights into the genetic basis and pathological mechanisms of iron overload disorders, providing a potential target for therapeutic intervention. Moreover, LP–BBS serves as a valuable natural model for studying hematogenous pigment disorders and their interplay with environmental factors.
Supplementary Information: The online version contains supplementary material available at 10.1186/s13578-025-01426-6.
Keywords: Black bone sheep; Hyperpigmentation; Iron overload; Macrophage; Systemic inflammation.
Conflict of interest statement
Declarations. Ethics approval and consent to participate: The study was approved by the Animal Ethics Committee of China Agricultural University (approval number 201206078) and was performed in accordance to Regulations of Experimental Animals of Beijing Authority. Experimental protocols conformed to the guidelines of the Beijing Laboratory Animal Welfare and Ethics Committee and were approved by the Beijing Association for Science and Technology (approval number SYXK-2012-04-07). Consent for publication: Not applicable. Competing interests: The authors declare that they have no competing interests.
Figures


Similar articles
-
Genomic and transcriptomic landscape to decipher the genetic basis of hyperpigmentation in Lanping black-boned sheep (Ovis aries).BMC Genomics. 2024 Sep 9;25(1):845. doi: 10.1186/s12864-024-10772-7. BMC Genomics. 2024. PMID: 39251902 Free PMC article.
-
Genetic diversity and genetic origin of Lanping black-boned sheep investigated by genome-wide single-nucleotide polymorphisms (SNPs).Arch Anim Breed. 2020 Jun 26;63(1):193-201. doi: 10.5194/aab-63-193-2020. eCollection 2020. Arch Anim Breed. 2020. PMID: 32760786 Free PMC article.
-
Calcium channel blockers for preventing cardiomyopathy due to iron overload in people with transfusion-dependent beta thalassaemia.Cochrane Database Syst Rev. 2023 Nov 17;11(11):CD011626. doi: 10.1002/14651858.CD011626.pub3. Cochrane Database Syst Rev. 2023. PMID: 37975597 Free PMC article.
-
Hepatic and cardiac iron overload quantified by magnetic resonance imaging in patients on hemodialysis: A systematic review and meta-analysis.Hemodial Int. 2023 Jan;27(1):3-11. doi: 10.1111/hdi.13054. Epub 2022 Nov 17. Hemodial Int. 2023. PMID: 36397717
-
3D-QSAR based computational screening of potent ligands against L-type calcium channel (LTCC) protein structure for iron overload in β-thalassemia.Comput Biol Med. 2025 Aug;194:110551. doi: 10.1016/j.compbiomed.2025.110551. Epub 2025 Jun 11. Comput Biol Med. 2025. PMID: 40505285
References
-
- Lin JY, Fisher DE. 2007. Melanocyte biology and skin pigmentation. Nature 445:843–850. 10.1038/nature05660. PMID: 17314970. - PubMed
-
- Wiemann J, Yang TR, Norell MA. 2018. Dinosaur egg colour had a single evolutionary origin. Nature 563:555–558. 10.1038/s41586-018-0646-5. PMID: 30464264. - PubMed
-
- Grace RF, Barcellini W. 2020. Management of pyruvate kinase deficiency in children and adults. Blood 136:1241–1249. 10.1182/blood.2019000945. PMID: 32702739. - PubMed
-
- Joly BS, Coppo P, Veyradier A. 2017. Thrombotic thrombocytopenic purpura. Blood 129:2836–2846. doi: 10.1080/17474086.2019.1611423. PMID: 31107120. - PubMed
Grants and funding
LinkOut - more resources
Full Text Sources
