. 2025 Jun;55(6):e51716.
doi: 10.1002/eji.202451716.

Remote Force Modulation of the T-Cell Receptor Reveals an NFAT-Threshold for CD4+ T-Cell Activation

Affiliations

Remote Force Modulation of the T-Cell Receptor Reveals an NFAT-Threshold for CD4+ T-Cell Activation

Joseph Clarke et al. Eur J Immunol. 2025 Jun.

Abstract

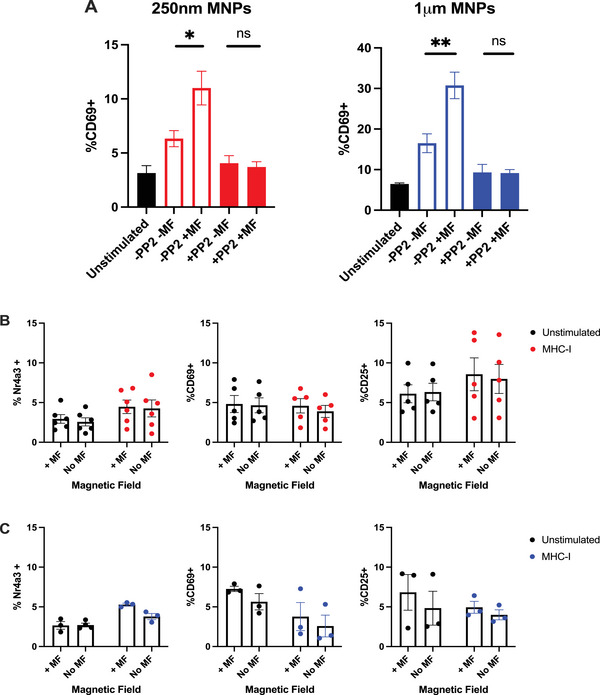
Mechano-modulation of cell surface proteins to influence cell activation has been shown as a promising new advanced therapy for regenerative medicine applications. These strategies rely on the manipulation of mechanosensitive cell surface receptors to initiate intracellular signal transduction. The cell surface receptor of T lymphocytes (TCR), which recognises peptide-MHC molecules central to driving the adaptive immune response, has recently been suggested to be mechano-responsive. Despite this advance, little is known as to whether the TCR can be mechanically modulated to achieve TCR signalling and subsequent T-cell activation, and whether these characteristics can be exploited for immunotherapies. Here, we describe a magnetic particle-based platform for mechanical modulation of the TCR and outline how this platform can be utilised to achieve CD4+ T-cell activation. We demonstrate that mechanical manipulation of the TCR induces cell surface clustering of the TCR and downstream TCR signalling, leading to eventual TCR downregulation and T-cell activation. We investigate the temporal relationship between mechanical modulation of the TCR and subsequent T-cell activation, thereby identifying that accumulation of signalling events within the NFAT pathway is required to reach the threshold required for CD4+ T-cell activation, outlining an axis which controls the CD4+ T-cell response to external mechanical cues. These findings identify how CD4+ T cells can modulate their function in response to such cues while also outlining a remote-magnetic particle-based platform that may be used for the control of T-cell responses.


Conflict of interest statement

The authors declare no conflicts of interest.

Figures

FIGURE 1
FIGURE 1
Force application for 1 h promotes TCR signalling events in Nr4a3 Tocky reporter (A, B), Tg4 transgenic (C) and RTO mouse models (D). 250 nm or 1 µm MNPs functionalised with anti‐CD3ε antibodies were bound to purified CD4+ T cells (Nr4a3 Tocky and Tg4 experiments), or bulk splenocytes (RTO experiments) before the application of magnetic force for 1 h. Unstimulated controls received medium alone (i.e., no MNPs). Following incubation for 4 h to allow for TCR signalling events to occur, cells were analysed for expression of either Nr4a3 from Nr4a3 Tocky mice (A, B) or CD69 and CD25 from Tg4 (C) or RTO (D) mice. All data shown are from a minimum of three independent experiments. Plots in A show representative flow cytometry plots from experiments utilising either 250 nm or 1 µm anti‐CD3ε functionalised MNPs. Significance assessed by Two‐way ANOVA with Sidak's post‐tests, **p < 0.01, ***p < 0.001, ****p < 0.0001.
FIGURE 2
FIGURE 2
Upregulation of TCR signalling in response to force application is specific to targeting the TCR‐CD3 complex. (A) Purified CD4+ T cells from Tg4 mice were treated with 250 nm or 1 µm anti‐CD3ε MNPs, with or without pre‐treatment with 10 µM PP2, and were subjected to 1 h of magnetic force as indicated. Pre‐incubation with 10 µM PP2 was sufficient to prevent upregulation of CD69 expression in response to force application. (B+C) Purified CD4+ T cells from Nr4a3 Tocky reporter mice were treated with either 250 nm (B) or 1 µm (C) anti‐MHC‐I functionalised MNPs and subjected to 1 h magnetic force application, before assessment of T cell activation marker expression 4 h later. The use of anti‐MHC‐I targeted MNPs failed to induce expression of Nr4a3, CD69 or CD25. Data are shown from a minimum of three independent experiments from A (250 nm MNP), B and C, or two independent experiments containing a total of three biological replicates (A, 1 µm MNP). Significance was assessed by one‐way ANOVA where the mean of each column was compared with every other column. *p < 0.05, **p < 0.01.
FIGURE 3
FIGURE 3
Force application to TCR‐CD3, and not CD28, positively impacts T‐cell activation. Purified CD4+ T cells from Nr4a3 Tocky reporter mice were treated with 250 nm MNPs functionalised as indicated, subjected to 1 h of magnetic force, before assessment of Nr4a3 (A), CD69 (B) and CD25 (C) expression 4 h later. Force application driven through the TCR‐CD3 complex, but not CD28, positively impacts T‐cell signalling and proliferation (D, E) as evidenced through the comparison between MNPs coated with both anti‐CD3 and anti‐CD28 antibodies (CD3:CD28) and MNPs treated with anti‐CD3 alone together with soluble CD28 antibody treatment. All data are shown from a minimum of three independent experiments. (E) Representative histogram traces showing cell trace violet (CTV) dilution at 3 days post‐force application. Statistical significance was assessed via two‐way ANOVA with Sidak's post‐tests. *p < 0.05, **p < 0.01, ***p < 0.001, ****p < 0.0001.
FIGURE 4
FIGURE 4
Force application to the TCR‐CD3 complex induces concurrent TCR downregulation and TCR signalling. (A–C) CD4+ T cells from Tg4 mice were treated with either 250 nm or 1 µm anti‐CD3ε MNPs as shown, before the application of magnetic force for 1 h and assessment of TCR expression 4 h later by flow cytometry. Cells that received neither MNP treatment nor magnetic field application served as unstimulated (unstim) controls. Where indicated, T cells were pre‐treated with 10 µM PP2 or an equivalent amount of DMSO as a control. (D, E) CD4+ T cells from Nr4a3 Tocky mice were treated with 250 nm or 1 µm anti‐CD3ε MNPs as indicated and subjected to 1 h of magnetic force. Cells were analysed for Nr4a3, CD69, CD25 and TCR expression 4 h later. Expression of these three activation markers is shown when gating on TCRlo CD4+ populations (i.e., CD4+ T cells that have downregulated their TCR and become TCRlo as shown in the representative gating in (B). All data shown are from a minimum of three independent experiments. Statistical significance was assessed as follows. (A) One‐way ANOVA with Dunnett's post‐tests comparing the means of each group with the no MF control. (C) One‐way ANOVA with Tukey's post‐tests comparing the means of all groups with the mean of every other group. (D, E) Two‐way ANOVA with Sidak's post‐tests. *p < 0.05, **p < 0.01, ***p < 0.001, ****p < 0.0001.
FIGURE 5
FIGURE 5
Actin cytoskeletal blockade via Latrunculin A abolishes TCRlo Nr4a3+ populations in response to magnetic force application. CD4+ T cells from Nr4a3 Tocky reporter mice were treated with anti‐CD3ε MNPs as indicated and subjected to 1 h of magnetic force. Where shown, cells were pre‐treated with concentrations of Latrunculin A indicated or equivalent amounts of DMSO as a control. Representative TCRβ expression profiles are shown in (A). (B) Percentage of cells downregulating their TCR across three (250 nm MNPs) or four (1 µm MNPs) independent experiments when stimulated with either 250 nm or 1 µm anti‐CD3ε MNPs with Latrunculin A treatment as shown. Expression patterns of Nr4a3 within either TCRlo (C) or TCRhi (D) populations indicate that Latrunculin A treatment prevents both TCR downregulation and Nr4a3 expression. All data shown are from a minimum of three independent experiments. Statistical significance was assessed via two‐way ANOVA with Sidak's post‐tests. *p < 0.05, **p < 0.01, ***p < 0.001, ****p < 0.0001.
FIGURE 6
FIGURE 6
Force manipulation of the TCR‐CD3 complex induces phosphorylation‐dependent TCR cluster formation. CD4+ T cells from Tg4 mice were treated with 1 µm anti‐CD3ε MNPs and subjected to magnetic force for the time frames shown, before fixation and staining for analysis of membrane TCR distribution via SMLM. Cells were stimulated on glass‐immobilised anti‐CD3/CD28 antibodies as a positive control. Force application for 5–15 min induced the formation of membrane TCR clusters, which appear to dissociate beyond these time points. Data shown in both (A) and (B) are from three to four individual independent experiments, within a minimum of 6 ROIs from individual cells analysed per condition per experiment. Statistical analysis was performed via the Kruskal–Wallis test with Dunn's multiple comparison post‐tests (A), or one‐way ANOVA with Sidak's multiple comparison post‐test (B). (A) ****p < 0.0001, ***p = 0.0003. (B) ****p < 0.0001, *p = 0.0422.
FIGURE 7
FIGURE 7
Cyclical force application induces signal accumulation along the NFAT‐Nr4a3 axis, promoting Nr4a3 expression. (A) CD4+ T cells were treated with 1 µm anti‐CD3ε MNPs, before the application of external magnetic force for either one full 60 min treatment or four rounds of 15 min of force treatments, each separated by 15 min of no force application. Robust Nr4a3 expression is achieved with both 60 min of magnetic force application and 4 x 15 min as outlined in (A). Data are shown from three independent experiments and statistical analysis via two‐way ANOVA with Sidak's post‐tests. **p < 0.01, ****p < 0.0001. (B) To probe signal accumulation along the NFAT signalling pathway, cells were treated with 1 µM of the calcineurin inhibitor cyclosporin A after the first (CSA‐1), second (CSA‐2), third (CSA‐3) or fourth (CSA‐4) 15 min magnetic force pulse. (C) Blockade of calcineurin prevents magnetic force‐induced signal accumulation along the NFAT signalling pathway, preventing Nr4a3 expression. Data are shown from three independent experiments. Statistical analysis was assessed with one‐way ANOVA, with Dunnett's multiple comparison post‐tests, comparing the mean of each group to the mean of the no magnetic force control. **p < 0.001, ****p < 0.0001. (D) Representative flow cytometry plots indicating Nr4a3 accumulation through pulsatile magnet application as described through panels (A–C).

Similar articles

Cited by

References

    1. Krogsgaard M., Juang J., and Davis M. M., “A Role for ‘Self’ in T‐Cell Activation,” Seminars in Immunology 19 (2007): 236–244. - PMC - PubMed
    1. Krogsgaard M., Li Q.‐J., Sumen C., Huppa J. B., Huse M., and Davis M. M., “Agonist/Endogenous Peptide‐MHC Heterodimers Drive T Cell Activation and Sensitivity,” Nature 434 (2005): 238–243. - PubMed
    1. Stefanová I., Dorfman J. R., and Germain R. N., “Self‐recognition Promotes the Foreign Antigen Sensitivity of Naive T Lymphocytes,” Nature 420 (2002): 429–434. - PubMed
    1. van der Merwe P. A., “Do T Cell Receptors Do It Alone?,” Nature Immunology 3 (2002): 1122–1123. - PubMed
    1. Chang V. T., Fernandes R. A., Ganzinger K. A., et al., “Initiation of T Cell Signaling by CD45 Segregation at ‘Close Contacts’,” Nature Immunology 17 (2016): 574–582. - PMC - PubMed

MeSH terms

Substances