

doi: 10.12688/wellcomeopenres.23971.1.
eCollection 2025.
The genome sequence of Atlantic Bluefin Tuna, Thunnus thynnus (Linnaeus, 1758)
Affiliations
- PMID: 40556665
- PMCID: PMC12186022
- DOI: 10.12688/wellcomeopenres.23971.1
Item in Clipboard
The genome sequence of Atlantic Bluefin Tuna, Thunnus thynnus (Linnaeus, 1758)
Wellcome Open Res.
.
Abstract
We present a genome assembly from a specimen of Thunnus thynnus (Atlantic Bluefin Tuna; Chordata; Actinopteri; Scombriformes; Scombridae). The genome sequence has a total length of 799.05 megabases. Most of the assembly (99.17%) is scaffolded into 24 chromosomal pseudomolecules. The mitochondrial genome has also been assembled, with a length of 16.53 kilobases. Gene annotation of this assembly on Ensembl identified 23,266 protein-coding genes.
Keywords: Atlantic Bluefin Tuna; Scombriformes; Thunnus thynnus; chromosomal; genome sequence.
Copyright: © 2025 Oomen RA et al.
Conflict of interest statement
No competing interests were disclosed.
Figures

(
a) Young-of-the-year (YOY) individual measuring approximately 25–30 cm, collected in September 2022 in the Western Mediterranean (Ligurian Sea, Italy). Photograph by Fulvio Garibaldi. (
b) YOY individuals measuring approximately 30 cm, collected in September 2013 in the Central Mediterranean (western Ionian Sea, Italy). Photograph by Agostino Leone.

The BlobToolKit snail plot provides an overview of assembly metrics and BUSCO gene completeness. The circumference represents the length of the whole genome sequence, and the main plot is divided into 1,000 bins around the circumference. The outermost blue tracks display the distribution of GC, AT, and N percentages across the bins. Scaffolds are arranged clockwise from longest to shortest and are depicted in dark grey. The longest scaffold is indicated by the red arc, and the deeper orange and pale orange arcs represent the N50 and N90 lengths. A light grey spiral at the centre shows the cumulative scaffold count on a logarithmic scale. A summary of complete, fragmented, duplicated, and missing BUSCO genes in the actinopterygii_odb10 set is presented at the top right. An interactive version of this figure is available at
https://blobtoolkit.genomehubs.org/view/GCA_963924715.1/dataset/GCA_963924715.1/snail .
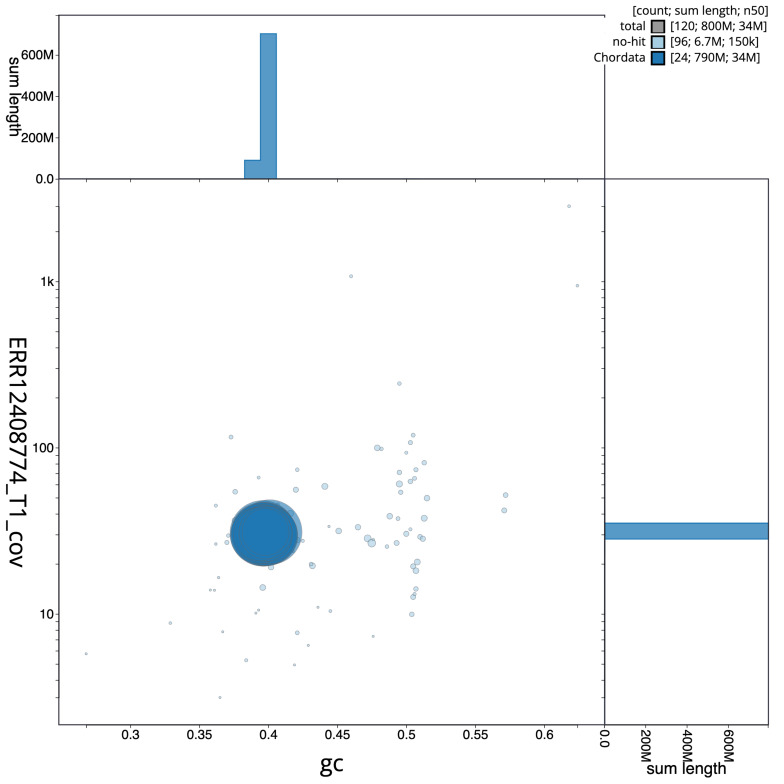
Blob plot showing sequence coverage (vertical axis) and GC content (horizontal axis). The circles represent scaffolds, with the size proportional to scaffold length and the colour representing phylum membership. The histograms along the axes display the total length of sequences distributed across different levels of coverage and GC content. An interactive version of this figure is available at
https://blobtoolkit.genomehubs.org/view/GCA_963924715.1/dataset/GCA_963924715.1/blob .

The grey line shows cumulative length for all scaffolds. Coloured lines show cumulative lengths of scaffolds assigned to each phylum using the buscogenes taxrule. An interactive version of this figure is available at
https://blobtoolkit.genomehubs.org/view/GCA_963924715.1/dataset/GCA_963924715.1/cumulative .
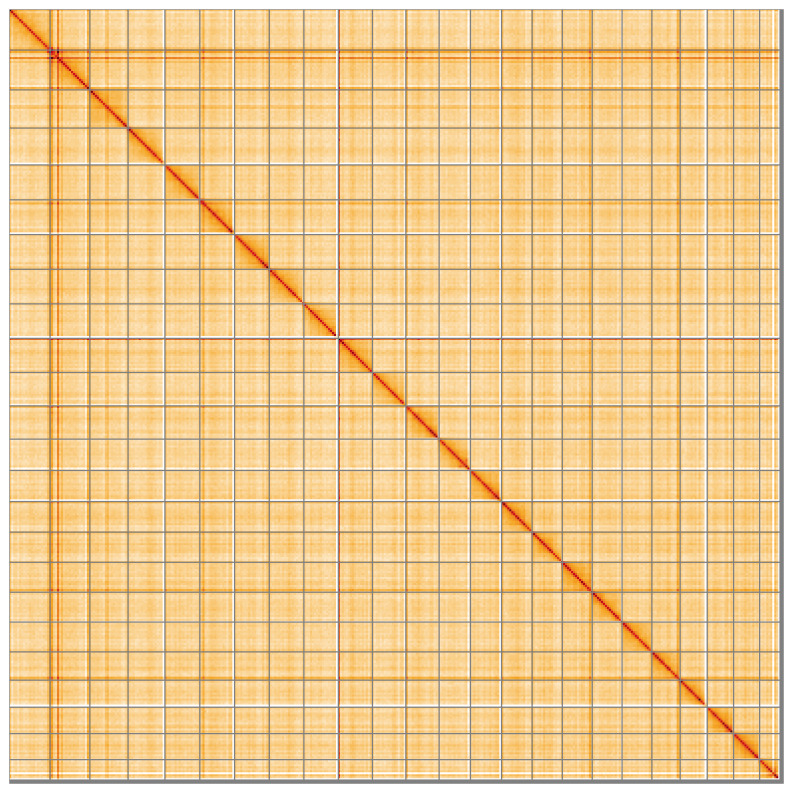
Chromosomes are shown in order of size from left to right and top to bottom. An interactive version of this figure may be viewed at
https://genome-note-higlass.tol.sanger.ac.uk/l/?d=CnETE950TKi3HPqRsxNUKg .
References
-
- Aalto EA, Dedman S, Stokesbury MJW, et al. : Evidence of bluefin tuna ( Thunnus thynnus) spawning in the Slope Sea region of the Northwest Atlantic from electronic tags. ICES J Mar Sci. 2023;80(4):861–877. 10.1093/icesjms/fsad015 - DOI
-
- Aalto EA, Ferretti F, Lauretta MV, et al. : Stock-of-origin catch estimation of Atlantic bluefin tuna ( Thunnus thynnus) based on observed spatial distributions. Can J Fish Aquat Sci. 2021;78(8):1193–1204. 10.1139/cjfas-2019-0445 - DOI
LinkOut - more resources
Full Text Sources
