. 2025 Jun 10:16:1547897.
doi: 10.3389/fpls.2025.1547897. eCollection 2025.

Transcriptome and gene co-expression network analysis revealed a putative regulatory mechanism of low nitrogen response in rice seedlings

Affiliations

Transcriptome and gene co-expression network analysis revealed a putative regulatory mechanism of low nitrogen response in rice seedlings

Bright G Adu et al. Front Plant Sci. .

Abstract

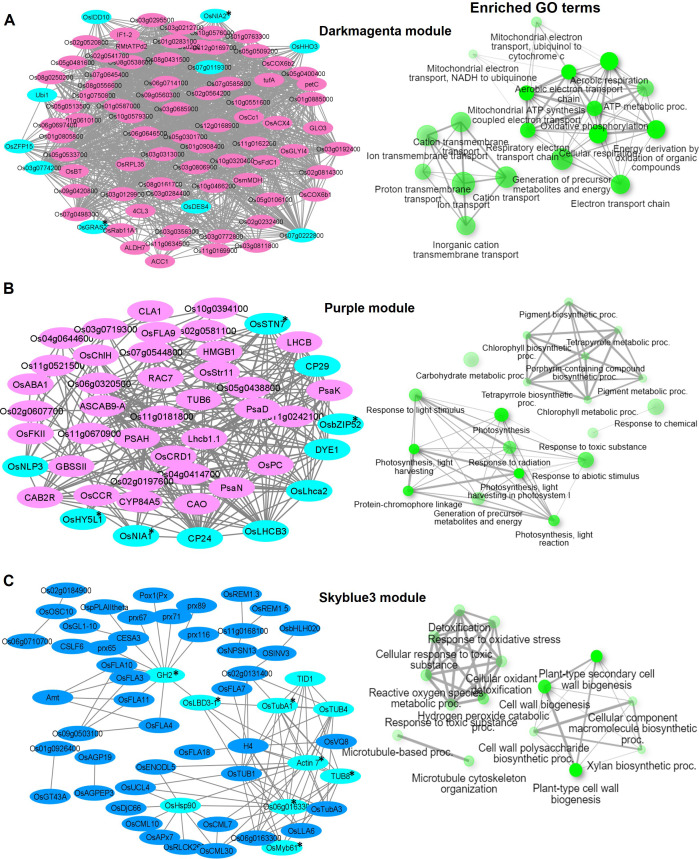
In rice, nitrate (NO3 -) and ammonium (NH4 +) are the main sources of inorganic nitrogen (N) for growth, which also serve as signaling molecules. Depending on the N status, plants modulate their physiological traits such as root system architecture (RSA) and transcriptome makeup, including N uptake and assimilation genes, to adapt to the amount of N available in the growth medium. In this study, time-course hydroponic experiment under low N (0.4 mM NH4 +) and sufficient N (1.6 mM NH4 +) was performed using low N tolerant introgression lines, KRIL8 and KRIL37, which carry a small region of the wild rice Oryza rufipogon genome in the Oryza sativa L. cv Koshihikari background. RNA-Seq analysis was used to profile changes in gene expression related to N and carbon metabolism which varied significantly and identified the accumulation of transcripts involved in secondary metabolite synthesis at the peak of low N stress. Weighted gene co-expression network analysis (WGCNA) identified several gene modules and their hub genes, including ion transport related modules consisting of genes that negatively regulate N uptake including OsHHO3, OsBT, and OsACTPK1 in all the lines. The repression of these genes under low N could be a basic mechanism to facilitate N acquisition in rice roots. The network analysis also identified cell activity and cell wall modification modules in the introgression lines which could be coordinated by OsLBD3-1, a paralogue of the Crown rootless1 gene for the promotion of root development to enhance N acquisition under low N conditions. The present analysis revealed the involvement of major pathways for low nitrogen tolerance of the selected lines.

Keywords: cell wall biogenesis; gene coexpression; ion transport; low nitrogen tolerance; transcriptome; wild rice introgression lines.


Conflict of interest statement

The authors declare that the research was conducted in the absence of any commercial or financial relationships that could be construed as a potential conflict of interest.

Figures

Figure 1
Figure 1
Seedling growth performance of the rice KH, KRIL8, and KRIL37 under hydroponic evaluation. The seedling characteristics of KH, KRIL8, and KRIL37 grown in modified Kimura B solution at 0.4 mM NH4 + (LN) and 1.6 mM NH4 + (NN) sampled across different time points (A–F). Shoot length (A), root length (B), shoot dry weight (C), root dry weight (D), shoot N percent (E), and root N percent (F). Nitrogen use efficiency parameters of KH, KRIL8, and KRIL37 computed at 168 hours of sampling (G–J). (G) Shoot NUpE, (H) root NUpE, (I) shoot NUE, and (J) root NUE. NUpE, nitrogen uptake efficiency (shoot N/N in solution); NUE, nitrogen use efficiency (dry shoot biomass/N in solution). Bars with *, **, and *** are significant at p<0.05, 0.01, and 0.001 respectively with KRIL8 or KRIL37 compared to KH using Dunnett’s test. Error bar = SD, n = 4–5.
Figure 2
Figure 2
Heatmap shows relative expression of N utilization and carbon metabolism related genes under low nitrogen (LN) conditions compared to normal nitrogen (NN) in each line. Heatmap showing differently expressed genes (DEGs) identified under LN conditions in comparison to NN in each genotype that are associated with N uptake, N assimilation, and carbohydrate metabolism in the (A) shoot and (B) root. The black line separates N utilization related genes from carbohydrate metabolism related genes. The vertical bar indicates relative expression ratio in log2 FC [DEGs were selected at FDR (p ≤ 0.05), and log2 FC ≥ |1| for upregulated and downregulated genes]. Gene code and gene symbol for each gene can be found at the Rice Annotation Project Database (https://rapdb.dna.affrc.go.jp/).
Figure 3
Figure 3
Weighted gene co-expression network analysis of DEGs into modules (colors). Hierarchical cluster tree showing dendrogram of DEGs and the assignment of co-expressed genes into modules (represented by colors) identified by weighted gene co-expression network analysis (WGCNA). Each leaf in the cluster tree represents one gene. The color strips were used for simple visualization of module assignment of each gene in (A) KH, (B) KRIL8, and (C) KRIL37. Module–traits relationship and significant modules identified in KH, KRIL8, and KRIL37 by WGCNA (D–F). (D) KH, (E) KRIL8, and (F) KRIL37. The modules highlighted with red border box represent significantly enriched modules associated with shoot nitrogen (S_N) or root nitrogen (R_N) concentration in each genotype. For values in the table, the top value is the corresponding correlation coefficient between the module eigengene and the phenotypic traits while the bottom in parentheses is p-value.
Figure 4
Figure 4
Visualization of connections of top genes in various modules of KH. Gene network analysis and GO terms of (A) Black module, (B) Darkred module, and (C) Salmon module. Turquoise-blue colored nodes suggest their central role in the network. Nodes with asterisks indicate upregulated central key genes. The network of biological processes (GO) that the genes are involved in is indicated on the right of the gene network.
Figure 5
Figure 5
Visualization of connections of top genes in various modules of KRIL8. Gene network analysis and GO terms of (A) Darkturquoise module, (B) Greenyellow module, (C) Midnightblue module, and (D) Steelblue module. Turquoise-blue colored nodes suggest their central role in the network. Nodes with asterisks indicate upregulated central key genes. The network of biological processes (GO) that the genes are involved in is indicated on the right of the gene network.
Figure 6
Figure 6
Visualization of connections of top genes in various modules of KRIL37. Gene network analysis and GO terms of (A) Darkmagenta module, (B) Purple module, and (C) Skyblue3 module. Turquoise-blue colored nodes suggest their central role in the network. Nodes with asterisks indicate upregulated central key genes. The network of biological processes (GO) that the genes are involved in is indicated on the right of the gene network.
Figure 7
Figure 7
Relationship between significant modules with similar GO terms. (A) Venn diagram showing the relationship between the Black module of KH, Greenyellow of KRIL8, and Darkmagenta of KRIL37 involved in ion transmembrane transport processes. The 51 genes shared between the three modules are shown in the intersection. A network of enriched biological terms of the 51 shared genes is shown as well as a heatmap showing the expression pattern of the 51 shared genes under low nitrogen (LN) in comparison to normal nitrogen (NN) in each genotype across the five time points. Most of the genes were downregulated under low N stress. (B) Venn diagram showing the relationship between the Midnightblue module of KRIL8 and Skyblue3 module of KRIL37 involved in cell wall organization processes. The 42 genes shared between the two modules are shown in the intersection. A network of enriched biological terms of the 42 shared genes are shown as well as a heatmap showing the expression pattern of the 42 shared genes in each line. Most of the genes were upregulated under low N stress. GO analysis was performed using ShinyGO (v.0.77). The vertical bar indicates relative expression ratio in log2 FC [DEGs were selected at FDR (p ≤ 0.05), and log2 FC ≥ |1| for upregulated and downregulated genes].
Figure 8
Figure 8
Proposed model depicting the mechanism of low N response in the lines. N deficiency as a signal result in the deactivation of genes involved in the negative regulation of ion transport in all lines. In KRIL8, this signal could be modulated by auxin response genes while that of KRIL37 could be modulated by Ca via calmodulin genes resulting in modification of the cell wall. The downstream regulatory component results in the transcriptional regulation of several pathways involved in nitrogen uptake and metabolism, carbon metabolism, and phenylpropanoid biosynthesis. The unbolded genes are downregulated while those in bold are upregulated. Genes in black are expressed in all the modules of all the lines, while those in purple are expressed in both KRIL8 and KRIL37 modules only. Those in red are specifically expressed in KRIL8 module while those in blue are expressed in KRIL37 module. Arrows indicate positive regulations, and bars indicate negative regulations.

Similar articles

References

    1. Adu B. G., Argete A. Y. S., Egawa S., Nagano A. J., Shimizu A., Ohmori Y., et al. (2022). A Koshihikari X Oryza rufipogon Introgression Line with a High Capacity to Take up Nitrogen to Maintain Growth and Panicle Development under Low Nitrogen Conditions. Plant Cell Physiol. 63, 1215–1229. doi: 10.1093/pcp/pcac097 - DOI - PubMed
    1. Ågren G. I., Weih M. (2012). Plant stoichiometry at different scales: Element concentration patterns reflect environment more than genotype. New Phytol. 194, 944–952. doi: 10.1111/j.1469-8137.2012.04114.x - DOI - PubMed
    1. Araus V., Vidal E. A., Puelma T., Alamos S., Mieulet D., Guiderdoni E., et al. (2016). Members of BTB gene family of scaffold proteins suppress nitrate uptake and nitrogen use efficiency. Plant Physiol. 171, 1523–1532. doi: 10.1104/pp.15.01731 - DOI - PMC - PubMed
    1. Asensi-Fabado M. A., Amtmann A., Perrella G. (2017). Plant responses to abiotic stress: The chromatin context of transcriptional regulation. In. Biochim. Biophys. Acta Gene Regul. Mech. 1860, 106–122. doi: 10.1016/j.bbagrm.2016.07.015 - DOI - PubMed
    1. Balkos K. D., Britto D. T., Kronzucker H. J. (2010). Optimization of ammonium acquisition and metabolism by potassium in rice (Oryza sativa L. cv. IR-72). Plant Cell Environ. 33, 23–34. doi: 10.1111/j.1365-3040.2009.02046.x - DOI - PubMed

LinkOut - more resources