. 2025 Jun 3;16(29):13256-13266.
doi: 10.1039/d5sc00768b. eCollection 2025 Jul 23.

Oxidant-assisted methane pyrolysis

Affiliations

Oxidant-assisted methane pyrolysis

Marco Gigantino et al. Chem Sci. .

Abstract

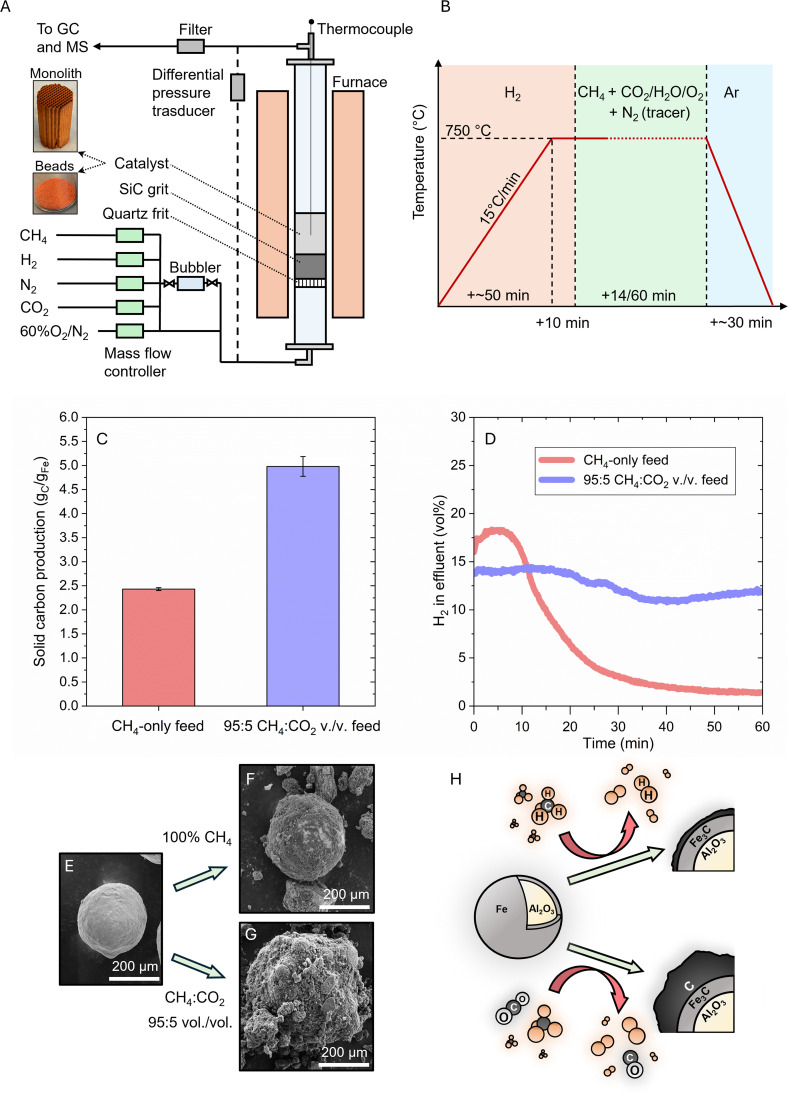
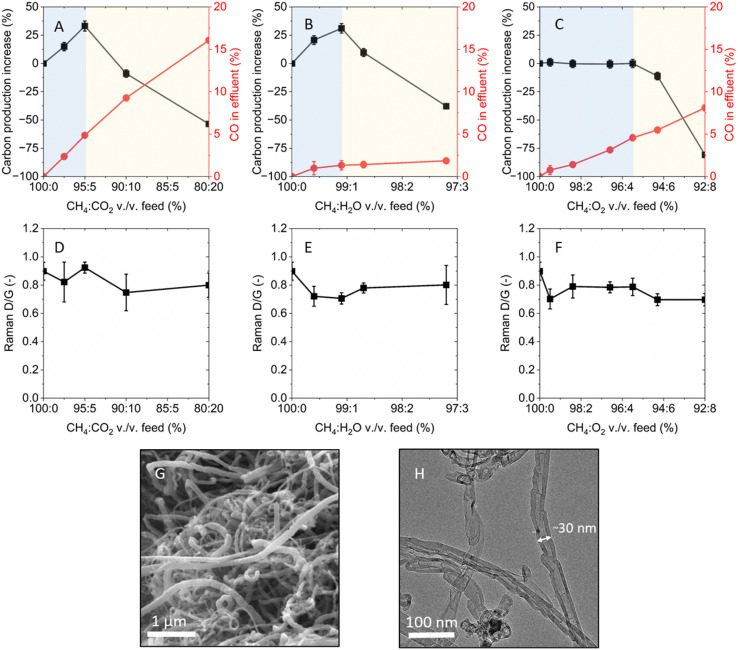
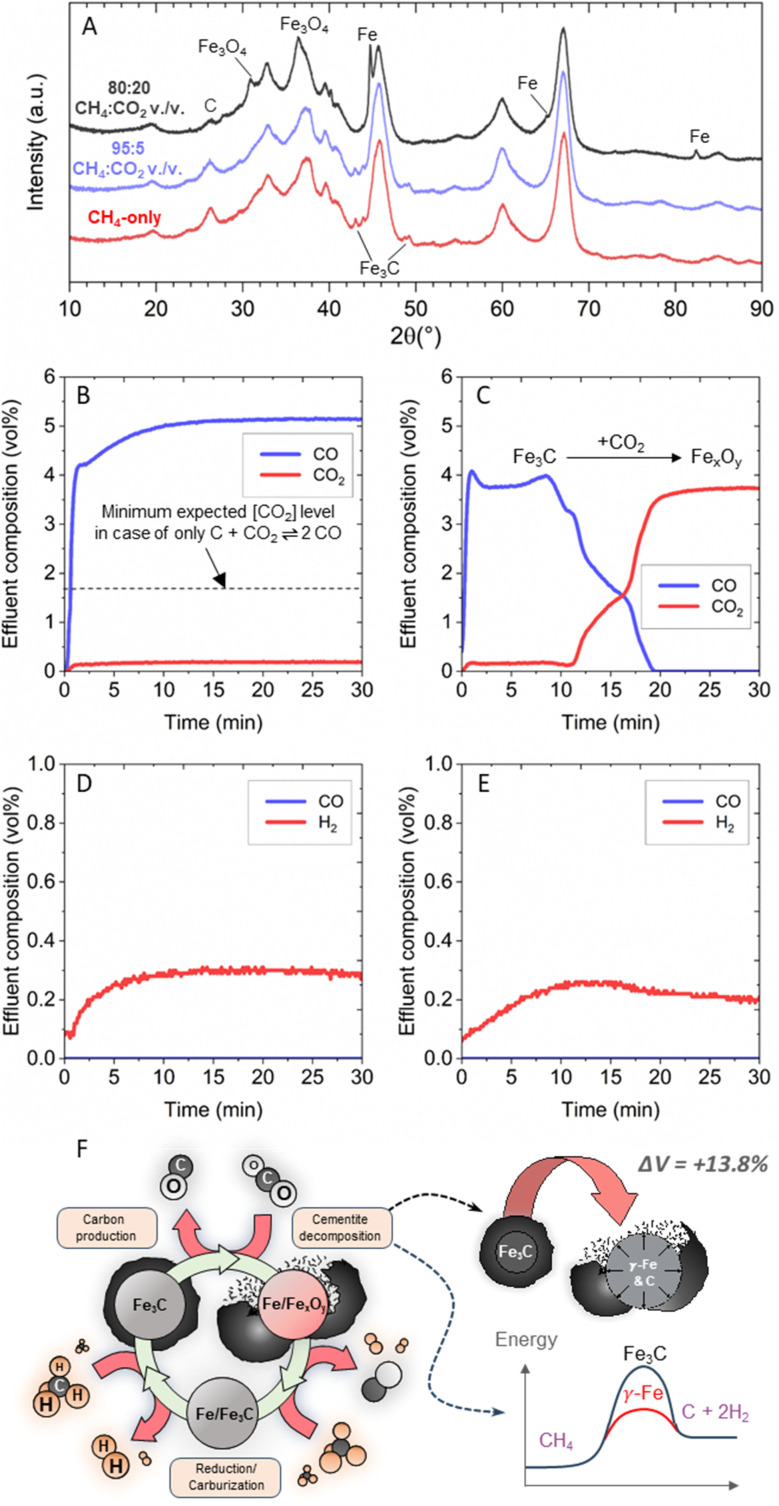
Methane pyrolysis has been proposed as a cost-competitive route to produce low-CO2-emissions hydrogen that can utilize today's infrastructure to supply feedstock and manage waste, and thereby be rapidly scalable. However, this process faces challenges such as catalyst deactivation and carbon build-up that hinder its large-scale implementation. Pyrolysis is usually conducted in the absence of oxidizers to avoid combustion products such as CO2. Here, we demonstrate that the addition of small concentrations of an oxidant to a methane pyrolysis reaction on Fe-based catalysts prevented catalyst deactivation and increased the net production of carbon and hydrogen. Methane pyrolysis in the presence of a small amount of CO2 demonstrated a twofold increase in carbon yield and a 7.5-fold increase in hydrogen concentration in the effluent compared to that of a pure methane feed during 1 h operation in a fluidized bed reactor at 750 °C. A similar beneficial effect was observed by adding small amounts of H2O in the feed. We provide evidence that the cyclic formation and decomposition of an iron carbide catalyst phase allowed for increased methane decomposition and significant carbon removal from the catalyst surface, thus increasing carbon and hydrogen yields. A similar result was obtained for Ni- and Co-based catalysts.


Conflict of interest statement

A provisional patent with the findings reported in this work was filed by Susteon Inc. and Stanford University.

Figures

Fig. 1
Fig. 1. Comparison of methane pyrolysis (MP) and oxidant-assisted methane pyrolysis (OMP). (A) Schematic of the reactor set-up. (B) Graphical illustration of the reactor operation consisting of 3 steps: (i) heat-up + catalyst reduction, (ii) pyrolysis and (iii) cool-down under inert atmosphere. (C) Carbon yield, normalized by the Fe catalyst mass, and (D) hydrogen concentration in the effluent for CH4-only and 95 : 5 CH4 : CO2 vol./vol. reactor feed after 1 h at 750 °C (the maximum measurement uncertainty is ±1.20% of the plotted values). (E) Catalyst bead before reaction. (F) Catalyst bead after reaction under CH4 flow. (G) Catalyst bead after reaction under 95 : 5 CH4 : CO2 vol./vol. flow. (H) Graphical visualization of MP versus OMP.
Fig. 2
Fig. 2. Product yield and carbon quality for different OMP conditions. Percentage of carbon produced relative to the methane-only feed experiment (left y-axis) and CO concentration in the reactor effluent (right y-axis) as a function of methane-to-oxidant vol./vol. ratio in the feed for (A) CO2, (B) H2O and (C) O2. On each plot, the area highlighted in blue indicates the OMP-controlled regime, while the area highlighted in yellow denotes the gasification-controlled regime. Raman ID/IG as function of methane-to-oxidant vol./vol. ratio for (D) CO2, (E) H2O and (F) O2. SEM (G) and TEM (H) images of the carbon produced with a CH4-only feed.
Fig. 3
Fig. 3. Mechanism for the enhanced catalytic activity in OMP. (A) XRD spectra of 5 wt% Fe/θ-Al2O3 catalysts tested under methane-only, 95 : 5 CH4 : CO2 vol./vol. and 80 : 20 CH4 : CO2 vol./vol. feed. (B) Fe3C and C mixture tested under a 95 : 5 Ar : CO2 vol./vol. feed (C) Fe3C tested under a 95 : 5 Ar : CO2 vol./vol. feed. (D) Fe3C and C mixture tested under a 99.1 : 0.9 Ar : H2O vol./vol. (E) Fe3C tested under a 99.1 : 0.9 Ar : H2O vol./vol. feed. (F) Graphical visualization of in situ cyclic formation-decomposition of cementite.
Fig. 4
Fig. 4. Comparison of OMP versus MP performance in different reactor configurations. Methane conversion as function of time in (A) fluidized-bed and (B) monolithic reactor. The maximum measurement uncertainty is ±1.20% of the plotted values for both the CH4-only and 95 : 5 CH4 : CO2 vol./vol. feeds in both reactor configurations, while for the 99.1 : 0.9 CH4 : H2O vol./vol. feed it is ±6.36% of the plotted values in the FBR, and ±1.40% of the plotted values in the monolithic reactor.

References

    1. bp Energy Outlook, 2024, Available from: https://www.bp.com/en/global/corporate/energy-economics/energy-outlook.html
    1. Sarpong K. A. Xu W. Gyamfi B. A. Ofori E. K. A step towards carbon neutrality in E7: The role of environmental taxes, structural change, and green energy. J. Environ. Manage. 2023;337:117556. doi: 10.1016/j.jenvman.2023.117556. - DOI - PubMed
    1. Rojas J. Zhai S. Sun E. Haribal V. Marin-Quiros S. Sarkar A. et al., Technoeconomics and carbon footprint of hydrogen production. Int. J. Hydrogen Energy. 2024;49:59–74. doi: 10.1016/j.ijhydene.2023.06.292. - DOI
    1. International Energy Agency (IEA), Global Hydrogen Review 2023, 2023, Available from: https://www.iea.org/reports/global-hydrogen-review-2023
    1. Hydrogen Shot|Department of Energy, Available from: https://www.energy.gov/eere/fuelcells/hydrogen-shot

LinkOut - more resources