

Trends and disparity in the provision and consumption of essential medicines in China from 2016 to 2021: institutional, regional, and economic variations
- PMID: 40556925
- PMCID: PMC12185506
- DOI: 10.3389/fpubh.2025.1555598
Trends and disparity in the provision and consumption of essential medicines in China from 2016 to 2021: institutional, regional, and economic variations
Abstract
Objective: Analyze the provision and consumption of essential medicines (EMs) across healthcare institutions, regions, and levels of economic development. Evaluate the mechanisms by which EMs policies promote their own implementation.
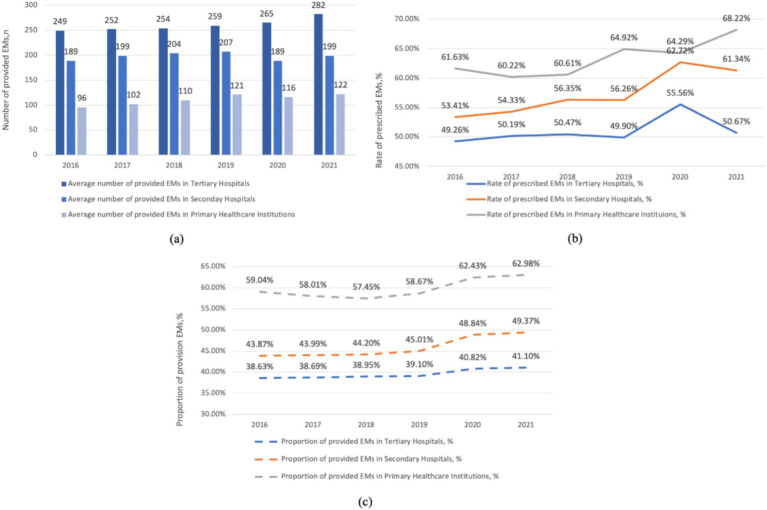
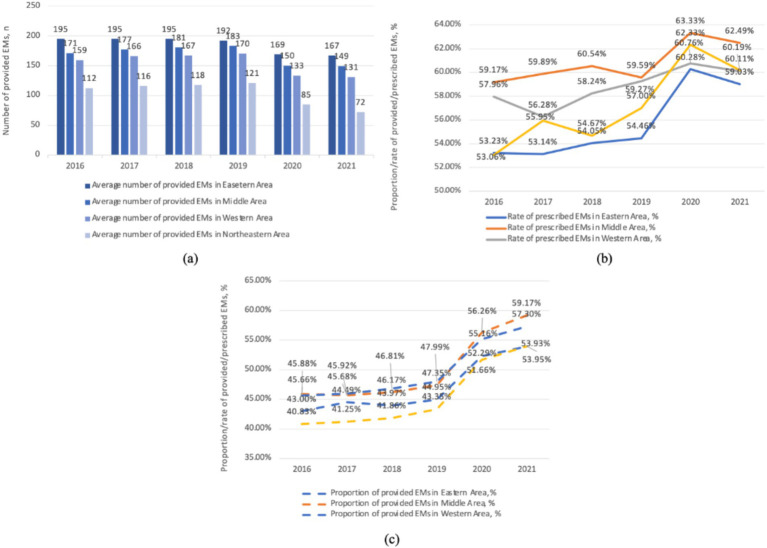
Methods: Using national drug utilization monitoring database (2016-2021), we perform a descriptive analysis to explore trends and disparities in EM provision and consumption across three institution levels, four regions (from 30 provinces), and different economic development levels in China. Key metrics include the average number and proportion of provided EMs and the consumption rate per healthcare institution. Utilize a two-way fixed-effects regression model to evaluate the relationship between EMs provision and consumption.
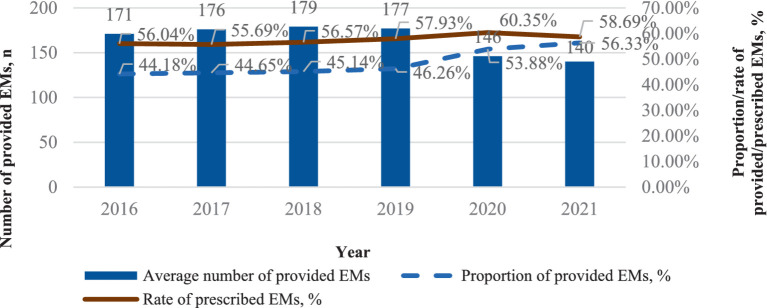
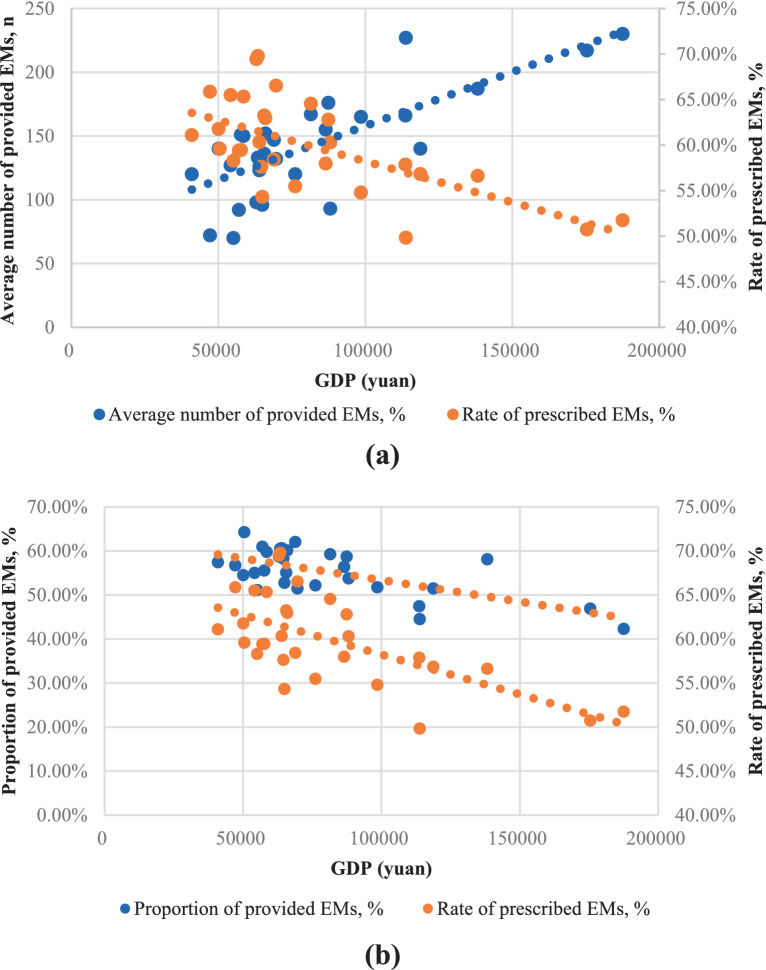
Findings: The average provided number of EMs is much lower than that in the national EMs list. Both provision (number and proportion) and consumption of EMs show institutional and regional disparities. There is a moderately positive correlation between EMs provided proportion and GDP (0.66, p < 0.01), while the provided proportion and consumption rate are moderately negatively correlated with GDP (-0.66, p < 0.01; -0.64, p < 0.01). In highly developed regions, EMs supply is highest but utilization lowest; in underdeveloped regions, provision is least but utilization relatively high.
Conclusion: This study shows disparities in EM provision and consumption across institutions, regions, and economic levels in China. Although essential medicine policy coordination with other policies needs improvement, targeted interventions are needed to bridge gaps in less developed regions and promote medicine equity.
Keywords: China’s healthcare system; EMs availability and consumption; equitable healthcare access; essential medicines availability; global health; regional disparities.
Copyright © 2025 Zhao, Lin, Ding, Han, Zhao, Gillani and Fang.
Conflict of interest statement
The authors declare that the research was conducted in the absence of any commercial or financial relationships that could be construed as a potential conflict of interest.
Figures
Similar articles
-
Regional disparities and influencing factors of health production efficiency: evidence from China.BMC Public Health. 2025 Jul 8;25(1):2406. doi: 10.1186/s12889-025-23537-y. BMC Public Health. 2025. PMID: 40629274 Free PMC article.
-
What are the key factors contributing to the inequity in healthcare resource allocation? Evidence from China's health panel data from 2009 to 2021.Front Public Health. 2025 Jul 18;13:1586585. doi: 10.3389/fpubh.2025.1586585. eCollection 2025. Front Public Health. 2025. PMID: 40756397 Free PMC article.
-
Intravenous magnesium sulphate and sotalol for prevention of atrial fibrillation after coronary artery bypass surgery: a systematic review and economic evaluation.Health Technol Assess. 2008 Jun;12(28):iii-iv, ix-95. doi: 10.3310/hta12280. Health Technol Assess. 2008. PMID: 18547499
-
Home treatment for mental health problems: a systematic review.Health Technol Assess. 2001;5(15):1-139. doi: 10.3310/hta5150. Health Technol Assess. 2001. PMID: 11532236
-
A rapid and systematic review of the clinical effectiveness and cost-effectiveness of paclitaxel, docetaxel, gemcitabine and vinorelbine in non-small-cell lung cancer.Health Technol Assess. 2001;5(32):1-195. doi: 10.3310/hta5320. Health Technol Assess. 2001. PMID: 12065068
References
-
- Essential medicines . World Health Organization Western Pacific. (2024). Available online at: https://www.who.int/westernpacific/health-topics/essential-medicines (accessed Nov 8, 2024)
-
- National essential medicines list. 2009 ed. Beijing: Central People’s Government of the People’s Republic of China. (2009). Available online at: https://www.gov.cn/govweb/gongbao/content/2009/content_1439293.htm (accessed Oct 26, 2024).
-
- National essential medicines list. 2012 ed. Beijing: Central People’s Government of the People’s Republic of China. (2012). Chinese. Available online at: https://www.gov.cn/gzdt/2013-03/15/content_2355145.htm (accessed Oct 26, 2024).
MeSH terms
Substances
LinkOut - more resources
Full Text Sources
Medical