. 2025 Jul;18(7):e013352.
doi: 10.1161/CIRCEP.124.013352. Epub 2025 Jun 25.

Early Atrial Remodeling Drives Arrhythmia in Fabry Disease

Affiliations

Early Atrial Remodeling Drives Arrhythmia in Fabry Disease

Ashwin Roy et al. Circ Arrhythm Electrophysiol. 2025 Jul.

Abstract

Background: Fabry disease (FD) is an X-linked lysosomal storage disorder caused by α-Gal A (α-galactosidase A) deficiency, resulting in multiorgan accumulation of sphingolipid, namely globotriaosylceramide. This triggers ventricular myocardial hypertrophy, fibrosis, and inflammation, driving arrhythmia and sudden death. Atrial fibrillation is common, yet the cellular mechanisms accounting for this are unknown.

Methods: To address this, we conducted ECG analysis from a large cohort of 115 adults with FD at varying cardiomyopathy stages. ECG P-wave characteristics were compared with non-FD controls. Cellular contractile and electrophysiological function were examined in a novel atrial cellular FD model developed and imputed into in silico atrial models to provide insight into mechanisms of arrhythmia. Induced pluripotent stem cells were genome-edited using Clustered Regularly Interspaced Short Palindromic Repeats-Cas9 to introduce the GLA p.N215S variant and differentiated into induced pluripotent stem cell-derived atrial cardiomyocytes (iPSC-CMs). Contraction, calcium handling, and electrophysiology experiments were conducted. Bi-atrial in silico models were developed with cellular changes as in GLA p.N215S iPSC-CMs.

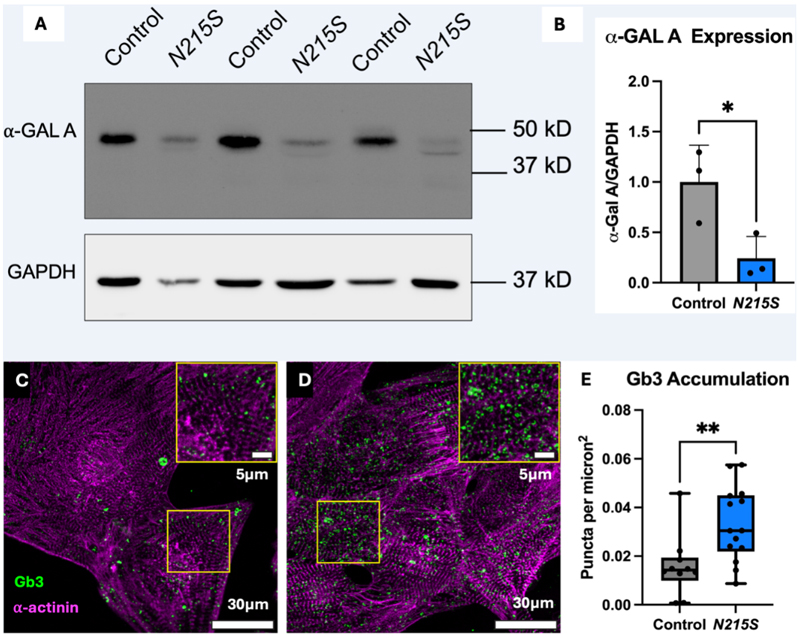
Results: ECG analysis demonstrated P-wave duration and PQ interval shortening in FD adults before the onset of cardiomyopathy. Patients with FD exhibited a higher incidence of premature atrial contractions and increased risk of atrial fibrillation compared with healthy controls. GLA p.N215S iPSC-CMs were deficient in α-Gal A and exhibited globotriaosylceramide accumulation. Atrial GLA p.N215S iPSC-CMs demonstrated a more positive diastolic membrane potential, faster action potential upstroke velocity, greater incidence of delayed afterdepolarizations, greater contraction force, and alterations in calcium handling compared with wild-type iPSC-CMs. Simulations with these changes in the in silico models resulted in similar P-wave morphology changes to those seen in early FD cardiomyopathy and increased atrial fibrillation vulnerability.

Conclusions: These findings provide novel insights into underpinning mechanisms for atrial arrhythmia and a rationale for early P-wave changes in FD. These may be targeted to develop therapeutic strategies to reduce the arrhythmic burden in FD.

Keywords: Fabry disease; adult; atrial fibrillation; electrocardiography; induced pluripotent stem cells.


Conflict of interest statement

None.

Figures

None
Graphical abstract
Figure 1
Figure 1
12-lead ECG analysis: (A) P-wave morphology changes on ECG (control vs stage 1 vs stage 4) (B-C) P-wave duration and PQ interval changes in controls and FD cardiomyopathy stages (D) LA volume changes in controls and FD cardiomyopathy stages on TTE. (E) Proportion of patients with AF Fabry vs control (F) P-wave duration in AF vs no AF (G) PAC on ECG (lead II) of adult with FD (H) Proportion of PACs Fabry Vs control (I) ECG (lead II) of AF in a patient with FD stage 1. Ordinary one-way ANOVA with Turkey’s multiple comparisons statistical test used comparing stages. Data presented as median ± 25th-75th percentile with whiskers indicating minimum and maximum values. Mann Whitney Test used to compare P-wave duration in AF vs no AF. Data presented as median ± 25th-75th percentile with whiskers indicating the minimum and maximum values. Fisher’s exact test used for proportion of patients with PACs and AF. * p ≤ 0.05, ** p ≤ 0.01, *** p ≤ 0.001
Figure 2
Figure 2. Confirmation of FD model.
(A) Western blot for α-GAL A protein levels (control vs N215S) in iPSC-CMs. (B) Quantification of α-GAL A expression (control vs N215S) in iPSC-CMs. Data presented as mean ± SD with whiskers indicating the minimum and maximum values (C-D) Immunofluorescence Gb3 (green) stain using confocal microscopy (A: control B: N215S) in atrial iPSC-CMs (α-actinin, purple) (E) Gb3 accumulation (control vs N215S) in atrial iPSC-CMs. Data presented as median ± 25th-75th percentile with whiskers indicating the minimum and maximum values. Mann Whitney U statistical test used,* p=<0.05, ** p=<0.01.
Figure 3
Figure 3
(A-C) Diastolic membrane potential from the APs of spontaneously beating iPSC-CMs, upstroke and amplitude from stimulated APs from iPSC-CMs at 1Hz (WT vs N215S). (D) Single cell atrial stimulated APs (WT vs N215S) illustrating quicker upstroke in N215S. (E) Stimulated atrial APs (WT vs N215S) illustrating DAD activity in N215S (circled in red) compared to no DAD activity in WT. (F) DAD quantification from the stimulated APs of iPSC-CMs documenting a greater number of N215S iPSC-CMs with DAD activity compared to WT. Welch’s unpaired t-test statistical test used for Diastolic membrane potential. Data presented as mean ± SD with whiskers indicating minimum and maximum values. Mann Whitney U test used for Stimulated Upstroke and Amplitude. Data presented as median ± 25th-75th percentile with whiskers indicating the minimum and maximum values. Fisher’s exact test used for comparison of number of DADs. * p ≤ 0.05, *** p ≤ 0.001, **** p ≤ 0.0001.
Figure 4
Figure 4
(A) Graphical outputs from MUSCLEMOTION in an N215S atrial iPSC-CM and (B) WT-iPSC-CM. (C-H) Intervals and contractility parameters from atrial iPSC-CMs (N215S vs WT) Values expressed as a percentage difference of the mean value for the WT of each batch. Mann Whitney U statistical test used for Contraction Duration, Time to Peak, Contraction Amplitude, Peak Amplitude and Relaxation time. Data presented as median ± 25th-75th percentile with whiskers indicating the minimum and maximum values. Welch’s unpaired t-test used for Peak to Peak time. Data presented as mean ± SD with whiskers indicating minimum and maximum values. ns not significant, * p ≤ 0.05, ** p ≤ 0.01.
Figure 5
Figure 5
(A) WT atrial iPSC-CM CTD map indicating shorter CTDs (blue), (B) N215S atrial iPSC-CM CTD map indicating longer CTDs (red), (C) Atrial calcium transients (N215S vs WT) illustrating changes in morphology and CTDs, (D-F) Atrial iPSC-CM CTD30, 50, 80 (N215S vs WT), (G-I) Interval and amplitude parameters (N215S vs WT), (J-L) Calcium conduction velocity assessment (N215S vs WT). Mann Whitney U statistical test used for CTD80, CTD50, Time to peak, Peak Amplitude, Frequency and calcium conduction velocity. Data presented as median ± 25th-75th percentile with whiskers indicating the minimum and maximum values. Welch’s Unpaired t-test used for CTD30. Data presented as mean ± SD with whiskers indicating minimum and maximum values * p ≤ 0.05, ** p ≤ 0.01, *** p ≤ 0.001, **** p ≤ 0.0001.
Figure 6
Figure 6. In silico investigation of the proarrhythmic profile of Fabry Disease (FD).
A) Action potential duration (APD) restitution slope, action potential amplitude and maximum upstroke velocity of 251 and 222 human atrial cardiomyocyte models representative of WT and GLA p. N215S atrial iPSC-CMs, respectively. Time course of the transmembrane voltage of a representative cardiomyocyte model in each subgroup, showing action potential alternans in the model representative of GLA p. N215S atrial iPSC-CMs (in blue). B) Schematic representation of the human atrial model inside a torso with the electrode location. It is illustrated the location of the sinus node (stimulation during sinus rhythm, SR) and the direction of propagation of an ectopic beat originating from the left pulmonary veins. Abbreviations: RA-LA: right and left arm; RL-LL: right and left leg. C) Comparison of clinical and simulated P-waves, considering the representative atrial cardiomyocyte models shown in A). Simulated P-wave duration in the 10 virtual patients with FD and 10 patients in control conditions. Representative atrial activation map of one virtual patient in each subgroup. D) AF vulnerability showing that AF is induced only when considering the electrophysiological changes caused by FD. E) Consecutive snapshots of the atrial transmembrane voltage (Vm) and corresponding ECG in control conditions and FD. The blue arrows on top of the atrial anatomy indicate the presence of rotors. Since the QRS is not simulated, the atrial repolarization (Ta-wave) can be seen on the ECG. Abbreviations: RA-LA: right and left atrium; rPV-lPV: right and left pulmonary veins.
Figure 7
Figure 7
Stages of cardiomyopathy in FD. Abbreviations: GLS: global longitudinal strain, LV: left ventricular, LGE: late gadolinium enhancement, LVH: left ventricular hypertrophy, NT-proBNP: N-terminal-pro brain natriuretic peptide.

References

    1. Desnick RJ, Blieden LC, Sharp HL, Hofschire PJ, Moller JH. Cardiac valvular anomalies in Fabry disease. Clinical, morphologic, and biochemical studies. Circulation. 1976 Nov;54(5):818–25. - PubMed
    1. Desnick RJ, Wasserstein MP. Fabry disease: clinical features and recent advances in enzyme replacement therapy. Adv Nephrol Necker Hosp. 2001;31:317–39. - PubMed
    1. Mehta A, Beck M, Eyskens F, et al. Fabry disease: a review of current management strategies. QJM. 2010 Sep;103(9):641–59. - PubMed
    1. Biegstraaten M, Arngrímsson R, Barbey F, et al. Recommendations for initiation and cessation of enzyme replacement therapy in patients with Fabry disease: the European Fabry Working Group consensus document. Orphanet J Rare Dis. 2015 Mar 27;10:36. doi: 10.1186/s13023-015-0253-6. - DOI - PMC - PubMed
    1. Vijapurapu R, Roy A, Demetriades P, et al. Systematic review of the incidence and clinical risk predictors of atrial fibrillation and permanent pacemaker implantation for bradycardia in Fabry disease. Open Heart. 2023 Jul;10(2) doi: 10.1136/openhrt-2023-002316. - DOI - PMC - PubMed

MeSH terms

Substances