. 2025 Aug;21(33):e2503990.
doi: 10.1002/smll.202503990. Epub 2025 Jun 25.

Novabeads: Stimuli-Responsive Signal-Amplifying Hydrogel Microparticles for Enzymeless Fluorescence-Based Detection of microRNA Biomarkers

Affiliations

Novabeads: Stimuli-Responsive Signal-Amplifying Hydrogel Microparticles for Enzymeless Fluorescence-Based Detection of microRNA Biomarkers

Haoliang Lu et al. Small. 2025 Aug.

Abstract

Robust and ultrasensitive biosensing platforms for detecting clinically relevant biomarkers from liquid biopsies are vital for precision diagnostics. However, detecting low-abundance biomarkers such as microRNA typically necessitates complex and costly enzyme-based strategies like PCR or isothermal amplification. Here, a materials-driven approach is leveraged to rationally design stimuli-responsive, signal-amplifying, and graphically-encoded hydrogel microparticles, termed Novabeads, for enzyme-free and fluorescence-based biomarker detection. Novabeads incorporate pH-responsive acrylic acid moieties within a polyethylene glycol diacrylate-based network, enabling significant volume reduction (≈5 fold) upon pH modulation. This stimuli-responsive shrinking, coupled with high bioreceptor loading via thiol-ene click chemistry, enables rapid, enzyme-free optical signal amplification. As a proof-of-concept, fluorescently-labeled peptide nucleic acid (PNA) probes are designed for detecting the cancer biomarker miR-16, via a fluorogenic Förster resonance energy transfer (FRET)-based signal. Novabeads exhibit >30 fold signal enhancement over equivalent conventional hydrogel microparticles, driven by three synergistic mechanisms: increased probe loading (≈2.6 fold), enhanced target capture (≈2.8 fold), and shrinkage-driven amplification (≈5 fold), ultimately leading to over 7 fold reduction in detection limit (28.8 pM; 2.9 fmol), and an expanded linear dynamic range. This rationally designed materials-driven biosensing strategy enables next-generation robust, versatile and enzyme-free biosensors for liquid biopsy diagnostics.

Keywords: biosensing; microRNA; peptide nucleic acid; smart hydrogel; stimuli‐responsive.


Conflict of interest statement

The authors declare no conflict of interest.

Figures

Scheme 1
Scheme 1
Schematic illustration demonstrating the working principle for enzyme‐free optical biosensing using Novabead hydrogel microparticles compared to equivalent standard hydrogel microparticles without stimuli‐responsive properties. Compared to standard beads, Novabeads offer greater bioreceptor (capture probe) loading capacity and a geometrical shrinking‐driven signal amplification strategy, enabling over 30 fold signal enhancement in an enzyme‐free manner.
Figure 1
Figure 1
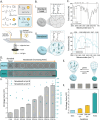
A) Schematic illustration of the stop‐flow‐lithography (SFL)‐based hydrogel microparticle synthesis strategy and composition of the precursor solutions for i) the standard and ii) Novabead microparticles. B) Chemical structure of i) standard beads and ii) Novabeads. C) (top) FTIR spectra of the standard beads and PEGDA precursor; (bottom) FTIR spectra of the Novabeads under acidic and alkaline pH. D) i) Representative brightfield microscopy (BF) images of Novabeads with increasing AA concentration under alkaline and acidic conditions (scale bar = 100 µm). The dashed white boxes are used to indicate the same representative standard bead (i.e., control which is not stimuli‐responsive). ii) Diameter of the blank Novabeads under alkaline (pH 8, data points in light blue) and acidic (pH 5, data points in dark blue) environments, and the corresponding shrinkage factor (gray bars)(error bars indicate standard deviation). E) Schematic illustration of the pH‐responsive behavior of the Novabeads, which can geometrically shrink under acidic pH and swell under alkaline pH. F) Calculated shrinkage factor and corresponding representative BF micrographs of 35% AA Novabeads under various stimuli: alkaline conditions, calcium at 0.1 and 500 mM, and acidic conditions.
Figure 2
Figure 2
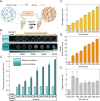
A) Schematic representation of the two probe biofunctionalization strategies: (left) ISF using acrydite‐modified probes and (right) PSF using thiolated probes. B) Quantification of the hydrogel microparticle's loaded probe concentration based on a calibration curve of Cy3 and Cy5 dyes. *** denotes p‐value < 0.001 from a t‐test. C) Fluorescence microscopy images of hydrogel microparticles after PSF of Cy3‐modified PNA under alkaline and acidic conditions (scale bar shows 100 µm), and ii) Fluorescence micrographs of representative standard and Novabead under alkaline (light blue) and acidic (dark blue) conditions following PSF with Cy3‐PNA. D) Shrinkage factor (SF) of Novabeads with increasing AA concentrations. E) Functionalization factor (FF) of Novabeads after PSF with Cy3‐modified PNA.
Figure 3
Figure 3
A) Schematic illustration of the experimental setup. B) i) Fluorescence micrographs (i) and average fluorescence intensity of standard beads and Novabeads under alkaline and acidic conditions, following hybridization with miR‐16‐Cy5 (scale bar shows 100 µm). C) Shrinkage factor (SF) of Novabeads following hybridization with miR‐16‐Cy5. Overall amplification factor (D) and capture factor (E) of Novabead microparticles with increasing AA concentrations.
Figure 4
Figure 4
A) Schematic representation of hydrogel microparticles with high or low Da. At high Da (Da >>1), the fluorescence signal becomes localized at the periphery of the microparticle, while a lower Da (Da<< 1) enables a more uniform signal distribution throughout the microparticle. B) Investigating the effect of varying initial PNA probe concentration (10 µM, 1 µM, 100 nM, and 10 nM) on Da. C) Investigating the effect of varying UV photopolymerization time (using 10 µM initial PNA probe concentration) on Da. D) Investigating the effect of varying UV photopolymerization time (using 1 µM initial PNA probe concentration) on Da, showing (i) fluorescence micrographs of representative Novabeads (scale bar shows 100 µm), ii) the associated average fluorescence intensity of Novabeads and (iii) the fluorescence intensity profile showing signal uniformity of a representative Novabead, under the given conditions.
Figure 5
Figure 5
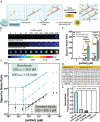
A) Schematic illustration of the biosensing strategy relying upon FRET‐based OTR within encoded Novabeads for microRNA detection, involving three steps: i) Adding the biofluid containing miRNA enabling its hybridization to the conjugated capture probe, ii) Adding the detector probe (fluorescently‐labelled) and enabling hybridization and FRET signal generation, and iii) Adding the amplification stimulus (pH 5 buffer) to shrink the Novabeads to enable fluorescence signal enhancement. B) Comparison of the biosensing performance of standard and Novabead microparticles (under alkaline and acidic conditions) via FRET‐based detection of miR‐16, showing i) Micrographs of representative microparticles (scale bar = 100 µm). ii) Calibration curves of SNR versus miRNA concentration. SNR is calculated as the ratio of the net signal (control‐subtracted signal) to the negative control; the control signal is from the 0 pM condition. Dashed lines indicate LOD as three times the standard deviation of the control (0 pM) condition. C) Comparison of the SNR of the Novabeads compared to the standard beads for two selected miRNA concentrations (250 and 500pM). D) Table of oligonucleotide sequences used in this experiment, including the synthesized PNA probes and commercial synthetic miRNAs. Letters in orange indicate the mismatched nucleotide. C* = cysteine residue. D* = aspartic acid residue. E) Specificity test for the optimized Novabeads (35% AA) under acidic conditions, demonstrating the FRET signal response to target miR‐16 (normalized to 1, light blue) compared with non‐target miR‐141 and three mutated miR‐16 sequences with one, two, and three individual SNPs. **** denotes p‐value < 0.0001 (t‐test).

Similar articles

References

    1. Huang F., Zhang Y., Lin J., Liu Y., Biosensors (Basel) 2021, 11, 190. - PMC - PubMed
    1. Siddika T., Heinemann I. U., Front. Bioeng. Biotechnol. 2021, 8, 619583. - PMC - PubMed
    1. Xue Y., Braslavsky I., Quake S. R., J. Biol. Chem. 2021, 297, 101270. - PMC - PubMed
    1. Schuelke M., Nat. Biotechnol. 2000, 18, 233. - PubMed
    1. Becherer L., Borst N., Bakheit M., Frischmann S., Zengerle R., von Stetten F., Anal. Methods 2020, 12, 717. - PubMed

LinkOut - more resources