. 2025 May 29;14(2):46.
doi: 10.3390/antib14020046.

Three-Dimensional Modeling of Camelus dromedarius T Cell Receptor Gamma (TRG)_Delta (TRD)/CD1D Complex Reveals Different Binding Interactions Depending on the TRD CDR3 Length

Affiliations

Three-Dimensional Modeling of Camelus dromedarius T Cell Receptor Gamma (TRG)_Delta (TRD)/CD1D Complex Reveals Different Binding Interactions Depending on the TRD CDR3 Length

Salvatrice Ciccarese et al. Antibodies (Basel). .

Abstract

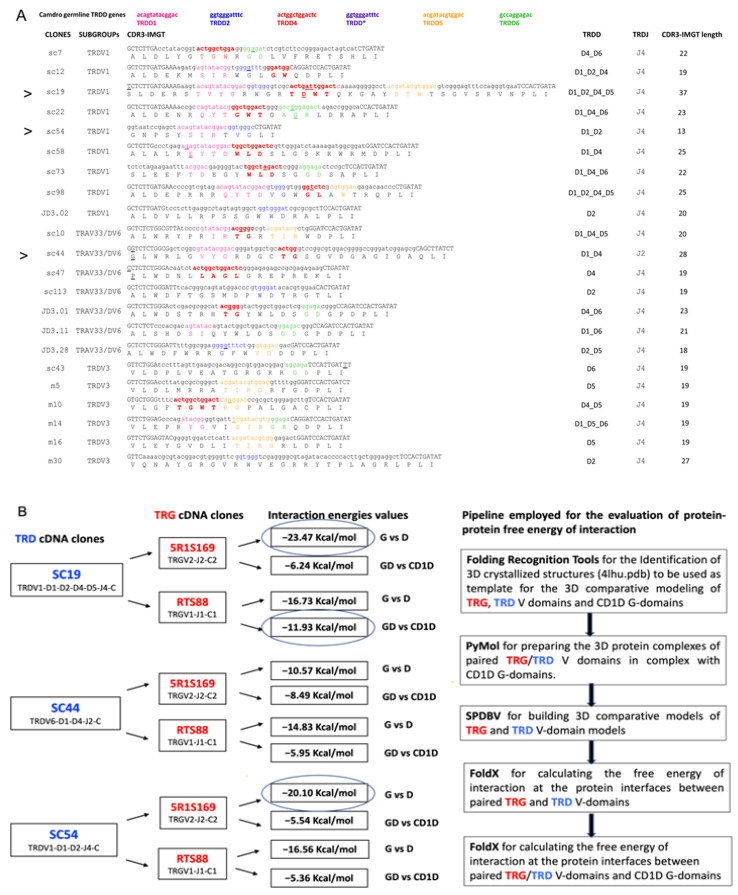
Background: In the adaptive immune response of the dromedary (Camelus dromedarius, Camdro), the T cell receptor (TR) repertoire of the gamma-delta (γδ) T cells is unusually diversified both by somatic hypermutation in rearranged TR gamma (TRG) and delta (TRD) genes and by the diversity in sequence and length of the third complementarity-determining region (CDR3) of the TRD chain.

Methods: The purpose was to investigate, in the absence of 3D structures, the role of Camdro γδ T cells, focusing on the binding interactions at the interface between the V-gamma and V-delta domains, and in complex with the CD1D, a major histocompatibily class I (MH1)-like glycoprotein presenting lipid antigen in association with B2M. A combination of hypermutated TRG dromedary cDNA clones was paired with TRD clones bearing very long, long, or short CDR3s, all isolated from the spleen of a single animal.

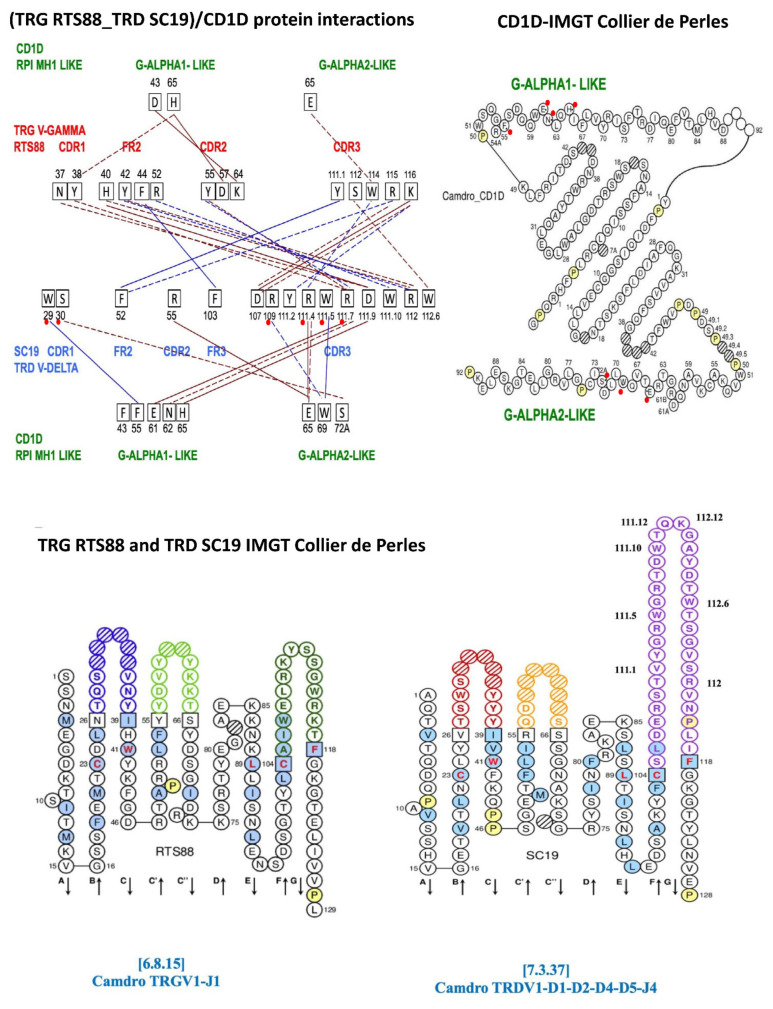
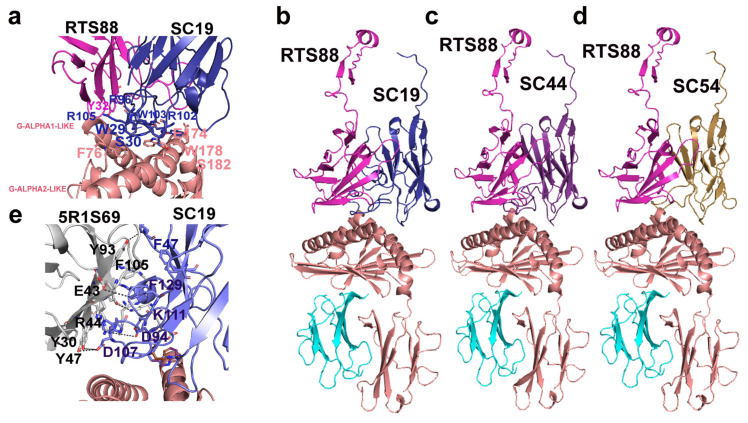
Results: The 3D models of the Camdro TRG_TRD/CD1D_B2M complexes were inferred using the Homo sapiens 3D structure and the ImMunoGeneTics (IMGT) numbering for V, C, and G domains, and investigated for binding interactions at the interface of the paired V-gamma_V-delta and at the interface with CD1D. Our results suggest that transcripts with long CDR3s may derive from a population of CD1D-restricted γδ T cells. Both the CD1D G-alpha1-like and G-alpha-2 like domain helices were contacted by both the V-gamma and V-delta CDR-IMGT loops.

Conclusions: Our findings further emphasize the similarity between the γδ T cells population we analyzed in Camelus dromedarius and the CD1D-restricted γδ NKT cells in Homo sapiens.

Keywords: 3D modeling; Camelus dromedarius; IMGT unique numbering; T cell receptor; TRG and TRD loci; multiple sequence alignments (MSA); protein–protein interaction.


Conflict of interest statement

The authors declare no conflict of interest.

Figures

Figure 1
Figure 1
(A) CDR3-IMGT nucleotide (nt) and predicted amino acid (AA) sequences retrieved from the TRD cDNA clones isolated from spleen [44]. CDR3-IMGT sequences are shown from codon 105 (the codon after the 2nd-CYS 104 of the V-REGION) to codon 117 (the codon before J-PHE 118 of the J-REGION) according to the unique numbering for V domain [12]. The CDR3 nucleotide/amino acid sequence, and the classification of the TRDV and TRDJ genes of each clone are also listed. The TRDV genes were assigned to the corresponding germline subgroup only [48]. Nucleotides of the 3’V-REGION and of the 5′J-REGION are indicated in uppercase letters. The sequences considered to present recognizable TRDD genes are indicated in colored lowercase letters (pink for TRDD1, blue for TRDD2, red for TRDD3, orange for TRDD5, green for TRDD6, and dark purple for the TRDD, missing in the current assembly), and the nucleotide substitutions are underlined. The amino acids belonging to a TRDD gene are in bold. Nucleotides that cannot be attributed to any V, D, or J region (P/N-nucleotides) are indicated in lower cases on the left and on the right sides of the TRDD regions. The name of each clone is reported with CDR3-IMGT length (AA), and with the contribution of TRD 3′V-REGION, TRDD, TRDJ 5′J-REGION, and P/N nucleotide sequences, using colors, small and capital letters as described above. (B) Scheme of the pipeline employed for the evaluation of protein–protein interaction energies. On the left, each TRD (SC19, SC44 and SC54) cDNA clone was combined with each TRG (5R1S169 and RTS88) cDNA clones. The V-(D)-J-C gene composition of the Camdro paired TRG_TRD V-domains corresponding to each combination is provided. In correspondence with each combination of the TRG and TRD examined clones (black arrows), the estimated negative energy values (kcal/mol) of the interactions at the protein interface in the complex between the paired TRG and TRD V-domains, and at the protein interfaces between the paired TRG/TRD V-domains and the CD1D G-domains are shown in succession. Additionally, the V-(D)-J-C gene composition of the paired TRG/TRD V-domains corresponding to each combination is provided. G vs. D indicates the value in Kcal/Mol referring to the dimer TRG_TRD; GD vs. CD1D indicates the value referred to the complex (TRG_TRD)/CD1D. The values inside the circles are considered the most significant, as they represent those closest to the H. sapiens negative energy value (see Table S1).
Figure 2
Figure 2
Protein–protein interactions at the protein interface between the Camelus dromedarius (Camdro)-paired TRG V-GAMMA (clone RTS88) and TRD V-DELTA (clone SC19) V-domains and at the protein interface in the complex between the paired TRG_TRD V-domains and the Camdro CD1D G-ALPHA1-LIKE and G-ALPHA2-LIKE G-domains. Four types of protein–protein interactions are shown: Protein–protein Ionic interactions within 6 Å (solid brown line), protein–protein side chain–side chain hydrogen bonds (dashed brown line), aromatic–aromatic interactions within 4.5 and 7 Å (solid blue line), cation–π interactions (dashed blue line). Top left, the amino acids involved in the interactions are shown in black squares with their positions according to the IMGT unique numbering for V-domain [13]. CDR and FR to which belong the AA involved in the interactions are written in red for RTS88 TRG V-GAMMA and in blue for SC19 TRD V-DELTA. In green the CD1D G-ALPHA1-LIKE and the G-ALPHA2-LIKE domains, with their respective amino acids and their positions involved in the interactions with the paired RTS88/SC19 V-domains. Top right, IMGT Collier de Perles of the G-ALPHA1-LIKE and the G-ALPHA2-LIKE domains of the Camdro CD1D [14], obtained using the IMGT/Collier-de-Perles tool [36]. Bottom left to right, IMGT Collier de Perles of the Camelus dromedarius TRGV1-J1 V-gamma domain [6.8.15] (clone RTS88) and the TRDV1-D1-D2-D4-D5-J4 V-delta domain [7.3.37] (clone SC19) [12,44,45]. For a list of all the detected interactions, see Supplementary Table S2. This list includes the four types of interaction reported Figure 2 top left and in Table 1, and in addition three types of interactions, hydrophobic interactions within 5 Å, main chain–main chain hydrogen bonds, and main chain–side chain hydrogen bonds. The software specifically used to generate these structural visualizations is part of the IMGT/Collier de Perles toolset, available through the IMGT web platform (https://www.imgt.org/, accessed on 4 March 2025).
Figure 3
Figure 3
The 3D comparative models of the C. dromedarius γδTR in complex with the 3D model of C. dromedarius CD1D are reported in cartoon representation. Panel (a). A zoomed view of the surface of interaction in the 3D comparative model of the γδTR (coded by RTS88, in magenta, and SC19, in dark blue, respectively) in complex with CD1D (in salmon) highlights examples of interacting amino acids involved in protein–protein interactions (see Table 1). The IMGT numbering is followed by the corresponding PDB numbering in brackets. Corrections: G-ALPHA-1-LIKE: F55 (instead of 76). G-ALPHA-2-LIKE: E65 (instead of 174), S72A (instead of 182), W69 (instead of 178). TRD: W29 and S30: OK, R111.7 (instead of 105), R109 (instead of 96), W111.5 (instead of 103), R111.4 (instead of 102). TRG: Y38 (instead of 32). Panels (bd), the 3D comparative models of the indicated γδTR in complex with the 3D model of C. dromedarius CD1D are reported for comparative purposes. RTS88 (TRG) is in magenta, SC19 in deep blue, whereas CD1D is in salmon. SC44 and SC54 are reported in pink and light orange, respectively. In the 3D models of panels (bd), B2M is in cyan. Panel (e). A zoomed view of the surface of interaction in the 3D comparative model of the γδTR (coded by 5R1S69, in gray, and SC19, in blue, respectively) in complex with CD1D (in salmon) is reported in panel (e). The negative energy value corresponding to −23.47 Kcal/mol in the 5R1S169_SC19 complex is shown in Figure 1B and in Table S1.

Similar articles

References

    1. Lefranc M.-P. Immunoglobulin and T Cell Receptor Genes: IMGT® and the Birth and Rise of Immunoinformatics. Front. Immunol. 2014;5:22. doi: 10.3389/fimmu.2014.00022. - DOI - PMC - PubMed
    1. Lefranc M.-P., Lefranc G. The Immunoglobulin Factsbook. Academic Press; Cambridge, MA, USA: 2001.
    1. Lefranc M.-P., Lefranc G. Immunoglobulins or Antibodies: IMGT® Bridging Genes, Structures and Functions. Biomedicines. 2020;8:319. doi: 10.3390/biomedicines8090319. - DOI - PMC - PubMed
    1. Lefranc M.-P., Lefranc G. The T Cell Receptor FactsBook. Academic Press; London, UK: 2001.
    1. Adams E.J., Gu S., Luoma A.M. Human Gamma Delta T Cells: Evolution and Ligand Recognition. Cell. Immunol. 2015;296:31–40. doi: 10.1016/j.cellimm.2015.04.008. - DOI - PMC - PubMed

LinkOut - more resources