. 2025 Jun 16;10(6):406.
doi: 10.3390/biomimetics10060406.

Transition Processes in Technological Systems: Inspiration from Processes in Biological Evolution

Affiliations

Transition Processes in Technological Systems: Inspiration from Processes in Biological Evolution

Martin Möller et al. Biomimetics (Basel). .

Abstract

With environmental challenges intensifying, a fundamental understanding and sustainable management of ongoing transition processes are crucial. Biological evolution provides valuable lessons on how to adapt and thrive under changing conditions. By studying its key principles, we identified analogies between biological evolution and technological transitions in terms of both the Multi-Level Perceptive and the path dependency model. The comparative study also revealed that, despite contrasting time scales, the generation-based and version-based developments are comparable. In addition, interesting similarities were found in the increase and decrease of variety and between fitness and consistency. The lessons learned from biology include "Give it a try", "Do not close for reconstruction", and "Keep older versions in the innovation process". Based on this comparison, we aim to gain insights for a better understanding of how to manage technology transitions and to derive concrete indicators for assessing and monitoring them. In doing so, we can provide action-oriented guidance for developing more sustainable technological solutions for major ongoing transitions, such as the energy transition.

Keywords: MLP (Multi-Level Perspective); energy transition; exnovation; fitness; generation; innovation; niche; path dependency; population; selection.


Conflict of interest statement

Author Martin Möller was employed by the company Öko-Institut Consult GmbH. The remaining authors declare that the research was conducted in the absence of any commercial or financial relationships that could be construed as a potential conflict of interest.

Figures
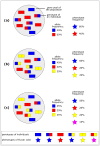
Figure 1
Figure 1
Overall processes of biological evolution resulting in increased variability. (a) Gene pool of a population with 10 individuals. The genotype is dependent on two alleles. In this example, the genotypes result in various phenotypes of flower color (blue and red), with the blue allele being dominant and red allele recessive. (b) Mutation results in a third type of allele and an additional phenotype (yellow flower color), with yellow being recessive. (c) Recombination results in new combinations of alleles (red and yellow) and thus in an additional phenotype (magenta flower color), with red and yellow being intermediate.
Figure 2
Figure 2
Overall processes of biological evolution resulting in decreased variability. Reproductive isolation in a population exhibiting blue and red flowers results in two populations and a change in allele and phenotype frequency. One population (shown above) has only blue flowers, while the other population (shown below) has red and blue flowers.
Figure 3
Figure 3
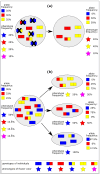
Genetic drift results in decreased variability. (a) Bottleneck effect caused by the random extinction of individuals by natural disasters (indicated by cross marks). (b) Founder effect, which results from the establishment of new populations based on the splitting off of a small number of individuals from the original population.
Figure 7
Figure 7
Model of path dependency applied to biological evolution. Colored stars represent existing phenotypes of flower colors with their respective genotypes, while gray stars represent non-existing phenotypes. Phase I is a completely open space representing the gene pool of the population, where the flower colors in the gray shaded area are more likely to occur. In phase II, the red phenotype gains an evolutionary advantage with respect to a biotic or abiotic selection factor (shown as a line). In phase III, due to isolation or genetic drift, the variability decreases to red phenotypes only. In phase IV, genetic changes lead to the appearance of yellow and magenta flowers. The model then restarts from the beginning with this population.
Figure 4
Figure 4
The Multi-Level Perspective with its embedded systems of landscape, regime, and niche is illustrated using the energy sector as an example. The pie charts show the reconfiguration of the energy regime from one dominated by fossil fuels and nuclear power (dark orange) to one dominated by renewable energy sources such as solar, wind, and hydro power (light orange). Adapted from [57].
Figure 5
Figure 5
Model of path dependency in technological transition. Black triangles represent available options, while gray triangles represent non-available options. Phase I is a completely open space of possibilities, where the triangles in the gray shaded area are more likely than others. In phase II, a path (depicted as a line) is created as a result of a special event (critical juncture). In phase III, lock-in occurs, which is the special case of maximum restriction of available options. In phase IV, alternative options are available again (un-locking) and the model starts from the beginning. Adapted from [64].
Figure 6
Figure 6
The Multi-Level Perspective attributed to ecosystems, organisms, and traits is illustrated using the evolution of vertebrates as an example. Initially, the world was dominated by early representatives of amphibians, reptiles, and fish (dark blue). Then dinosaurs and birds dominate, while early mammals appear (light blue). After the extinction of the non-avian dinosaurs, more recent amphibians, reptiles, birds, and mammals filled the vacant ecological niches. However, there are still surviving members of taxa that were very diverse in earlier eras, such as the Tuatara, which are often denominated “living fossils”.

Similar articles

References

    1. Olbrich S., Bauknecht D. The system building perspective for building sustainable system configurations using the German energy transition as an example. Oxford Open Energy. 2024;3:oiae010. doi: 10.1093/ooenergy/oiae010. - DOI
    1. European Environment Agency Europe’s Sustainability Transitions Outlook: Short-Term Action, Long-Term Thinking. 2024. [(accessed on 20 March 2025)]. Available online: https://www.eea.europa.eu/en/analysis/publications/europes-sustainabilit....
    1. Luu R.K., Arevalo S., Lu W., Ni B., Yang Z., Shen S.C., Berkovich J., Hsu Y.C., Zan S., Buehler M.J. Learning from nature to achieve material sustainability: Generative AI for rigorous bio-inspired materials design. MIT Explor. Gener. AI. 2024 doi: 10.21428/e4baedd9.33bd7449. - DOI
    1. Möller M., Höfele P., Kiesel A., Speck O. Reactions of sciences to the Anthropocene: Highlighting inter- and transdisciplinary practices in biomimetics and sustainability research. Elem. Sci. Anthr. 2021;9:035. doi: 10.1525/elementa.2021.035. - DOI
    1. Brundtland Commission . Our Common Future: Report of the World Commission on Environment and Development. Volume 10 Oxford University Press; Oxford, UK: 1987.

LinkOut - more resources