. 2025 Sep;12(34):e06651.
doi: 10.1002/advs.202506651. Epub 2025 Jun 25.

Spatiotemporal Adaptations-Driven Dynamic Thra Activation Simulates a Skin Wound Healing Response

Affiliations

Spatiotemporal Adaptations-Driven Dynamic Thra Activation Simulates a Skin Wound Healing Response

Zeming Li et al. Adv Sci (Weinh). 2025 Sep.

Abstract

The evolutionary adaptation of skin repair drives sequential regenerative phases: epidermal proliferation rapidly restores barrier function, followed by dermal reconstruction through extracellular matrix remodeling to establish structural support, yet the molecular coordination of this spatiotemporal program remains unclear. While the endocrine system is crucial in modulating wound repair, the critical hormone receptors orchestrating tissue-layer-specific responses are unidentified. Here, bulk and single-cell RNA sequencing, spatial transcriptomics, and in vivo/in vitro analyses in mouse models of hyperthyroidism and hypothyroidism, as well as wound and skin organoid models, are employed to identify the thyroid hormone receptor Thra as a key regulator of phase-coupled regeneration through two distinct yet coordinated mechanisms. In the initial phase, epidermal Thra activates glutathione metabolism via Gamma-Glutamylcyclotransferase (GGCT), driving keratin filament assembly to accelerate reepithelialization. In the subsequent phase, dermal Thra mediates the Serum Amyloid A3 (SAA3)-Fibronectin 1 (FN1) interaction, establishing angiogenic niches essential for matrix maturation. Using the self-assembled epidermis-dermis dynamic skin organoid model, Thra's role in simulating the wound healing process is further confirmed. This study highlights the essential role of spatiotemporal adaptability in wound repair using Thra as a paradigm and provides insights for developing clinical strategies to enhance skin wound healing.

Keywords: SAA3; glutathione metabolism; skin organoids; thyroid hormone; wound healing.


Conflict of interest statement

The authors declare no conflict of interest.

Figures

Figure 1
Figure 1
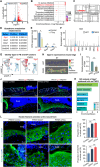
Spatiotemporal expression of THRA upregulated on post‐wounding day 3. A) Illustration of the influence of different hormones on the wound repair process. B) Heat Plot of the expression of different hormone receptors in HST and PWD3 skin. C) Bulk RNA‐seq analysis of Thra expression levels on day 0 and 3 post‐wounding; qRT‐PCR analysis of Thra expression levels on day 0, 3, and 7 post‐wounding. (N = 3, *p < 0.05). D) FeaturePlots of the expression of Thra in HST and PWD3 skin within FB and EPI clusters. E) Western blotting analysis of THRA protein levels on D0 and PWD3. (N = 3, *p < 0.05). F) Spatial transcriptomics data of the expression of Thra in HST and PWD3 skin. G) Immunofluorescence images of THRA expression on PWD3, with statistical analysis of THRA+ cells in the epidermis and dermis. (Scale bars, 100 µm; N = 5, * *p < 0.01). H) Schematic summary of the expression of Thra post‐wounding. I) GO analysis of pathways enriched in Thra‐positive cells in the epidermis and dermis post‐wounding.
Figure 2
Figure 2
Inhibition of Thra delayed epithelialization and dermal collagen deposition. A) Phase‐contrast microscope images and schematic analysis of wound healing process after Thra inhibition treatment, with statistical analysis of the average wound rate. (Scale bars, 1 mm. N = 5, * *p < 0.01, *p < 0.05). B) Immunofluorescence images of K14 expression in the control and Thra inhibition groups, with statistical analysis of re‐epithelialization length. (Scale bars, 200 µm; N = 5, p <0.01, *p < 0.05). C) Immunofluorescence images of K14/PCNA expression in the control and Thra inhibition groups, with statistical analysis of the average number of PCNA+ cells. (Scale bars, 100 µm; N = 5, * *p < 0.01, *p < 0.05). D) Masson's trichrome staining images of the control and Thra inhibition groups. (Scale bars, 100 µm). E) Statistics of the average collagen deposition. (N = 5, * *p < 0.01, *p < 0.05). F) Schematic summary of the wound healing process after Thra inhibition treatment.
Figure 3
Figure 3
High expression level of TH promoted wound repair. A) Schematic illustration of the experimental design for hyperthyroidism and hypothyroidism models, with statistical analysis of average TT4 and T3 concentrations from ELISA assays. (N = 5, * *p < 0.01, *p < 0.05). B) Phase‐contrast microscope images and schematic analysis of wound healing status on PWD3 after thyroid dysfunction treatments, with statistical analysis of the average wound area rate. (Scale bars, 1 mm. N = 5, *p < 0.05). C) Immunofluorescence images of K14, PCNA/K14 and E‐cadherin/CD31 expressions in the control, hypothyroidism and hyperthyroidism groups, with statistical analysis of the average re‐epithelialization length, and the average numbers of PCNA+ and CD31+ cells. (Scale bars, 100 µm; N = 5, * *p < 0.01, *p < 0.05). D) Masson's trichrome staining images of the control, hypothyroidism and hyperthyroidism groups. (Scale bars, 100 µm). E) Statistics of the average collagen deposition. (N = 5, *p < 0.05). F) Schematic summary of the wound healing process after thyroid dysfunction treatments.
Figure 4
Figure 4
Thra‐regulated glutathione metabolism in the epidermis. A) Volcano Plot of the distribution of down‐ and up‐ regulated genes in the control and Thra‐inhibited wounded groups. B) KEGG analysis of pathway enriched in the Thra‐inhibited wounded group. C) iPATH analysis of the impact on metabolism pathways in the Thra‐inhibited wounded group. D) A list of the top 5 ranked genes related to glutathione metabolism according to their P‐values and p‐adjustments. E) Statistics of the expression levels of the top three ranked genes in the bulk RNA sequencing data in terms of CPM. (N = 3, *p <0.05). F) VlnPlot of the expression of Ggct. G) FeaturePlots of the expression of Ggct in HST and PWD3 skin within FB and EPI clusters. H) Spatial transcriptomics data of the expression of Ggct in HST and PWD3 skin. I) qRT‐PCR analysis of Ggct expression levels after Thra knockdown. (N = 3, ** p < 0.01) J) Immunofluorescence images of GGCT expression in the control and aThra groups. (Scale bars, 100 µm). K) GO analysis of pathways enriched in Ggct‐positive epidermal cells post‐wounding. L) Immunofluorescence images of K14 and FACTIN expressions in the control, GGCT and aThra groups, with statistical analysis of the average proportion of K14 and FACTIN in total cells. (Scale bars, 50 µm; N = 5, * *p < 0.01).
Figure 5
Figure 5
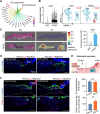
Thra‐activated SAA3 upregulated at the dermal wound edge. A) Pie chart of the genes in the top two signaling pathways in Thra‐positive cells in the FB post‐wounding. B) VlnPlot and FeaturePlots of the expression of Saa3. C) Spatial transcriptomics data of the expression of Saa3 in HST and PWD3 skin, with statistical analysis of expression level of Saa3. (N = 3, *p < 0.05) D) Immunofluorescence images of SAA3 expression in the control and aThra groups. (Scale bars, 200 µm; N = 5) E) Schematic summary of the wound healing process after SAA3 treatment. F) Immunofluorescence images of PCNA/K14 expression in the control and SAA3 groups, with statistical analysis of the average re‐epithelialization length and the average number of PCNA+ cells. (Scale bars, 200 µm; N = 5, * *p < 0.01, ns: no significance).
Figure 6
Figure 6
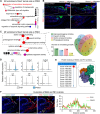
SAA3 favored dermal FN1 protein functions. A) GO analysis of pathways enriched in Saa3‐positive dermal cells post‐wounding. B) Immunofluorescence images of CD31/K14 expression in the control and SAA3 groups. (Scale bars, 200 µm; N = 5) C) MF analysis of pathways enriched in Saa3‐positive dermal cells post‐wounding; Venn Plot of the six most strongly related genes. D) VlnPlots of the expression of the six most strongly related genes. E) Protein docking of the binding status of SAA3 and FN1. F) Immunofluorescence images of SAA3, FN1 and FN1/SAA3 expressions post‐wounding. (Scale bars, 100 µm; Statistics of gray value traces).
Figure 7
Figure 7
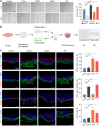
GGCT, SAA3, and TH regulatory networks demonstrated in mouse skin organoid models. A) Epithelial scratch assay results of the migratory ability of cells in different treatment groups, with statistical analysis of the average scratch area. (Scale bars, 200 µm; N = 3, * *p < 0.01, *p < 0.05, ns: no significance) B) Schematic illustration of the experimental design for mouse skin organoids. C) Immunofluorescence images of VIM/K14, PCNA/K14, Ecad/P63, and CD31/K14 expressions on the sixth day of cultured skin organoids, with statistical analysis of the average number of PCNA+ cells in dermis, the average number of P63+ cells in epidermis and the average number of CD31+ cells. (Scale bars, 50 µm; N = 3, * *p < 0.01, *p < 0.05, ns: no significance).
Figure 8
Figure 8
Graphical abstract. The activation of Thra in the epidermis influenced the expression of GGCT, regulating glutathione metabolism in epidermal cells and promoting epithelial regeneration. In the dermis, Thra upregulated SAA3 expression and interacted with FN1, regulating vascular development and supporting molecular functions.

References

    1. Ben‐Moshe S., Veg T., Manco R., Dan S., Papinutti D., Lifshitz A., Kolodziejczyk A. A., Bahar Halpern K., Elinav E., Itzkovitz S., Cell Stem Cell 2022, 29, 973. - PubMed
    1. Chen F., Tchorz J. S., Cell Stem Cell 2022, 29, 871. - PubMed
    1. Peña O. A., Martin P., Nat. Rev. Mol. Cell Biol. 2024, 25, 599. - PubMed
    1. Sun X., Joost S., Kasper M., Cold Spring Harb. Perspect. Biol. 2023, 15, a041232. - PMC - PubMed
    1. Talbott H. E., Mascharak S., Griffin M., Wan D. C., Longaker M. T., Cell Stem Cell 2022, 29, 1161. - PMC - PubMed

LinkOut - more resources