. 2025 Jun 25;14(7):szaf024.
doi: 10.1093/stcltm/szaf024.

Mettl7a alleviated bone loss in osteoporosis mice by targeting the O-GlcNAcylation of Bsp via m6A methylation

Affiliations

Mettl7a alleviated bone loss in osteoporosis mice by targeting the O-GlcNAcylation of Bsp via m6A methylation

Yantong Wang et al. Stem Cells Transl Med. .

Abstract

Postmenopausal osteoporosis, a prevalent metabolic bone disease, elevates susceptibility to fragility fractures while imposing substantial healthcare costs and public health challenges. The profound interplay between BMSCs and surrounding extracellular matrix (ECM) proteins, which are highly rich in O-GlcNAcylation, play pivotal roles in the process of osteoporosis. M6A methylation plays a crucial regulatory role in the development of osteoporosis, while the crosstalk between m6A methylation and ECM O-GlcNAcylation remains mechanistically undefined. Here we found Mettl7a overexpression improved the impaired osteogenic capability of OVX-mBMSCs in vitro. Conditional knockout of Mettl7a in the mesenchyme (Prx1-cre;Mettl7af/f) accelerated bone loss of OVX mice. Mechanistically, Mettl7a promoted mBMSCs osteogenic differentiation by targeting the O-GlcNAcylation of Bsp, an ECM protein. Mettl7a regulated the expression and O-GlcNAcylation of Bsp through m6A methylation of Oga. We further demonstrated that Mettl7a-AAV treatment alleviated bone loss phenotype in osteoporosis mice via the O-GlcNAcylation of Bsp. Collectively, our findings reveal novel mechanistic intersections between ECM protein O-GlcNAcylation and m6A methylation, advancing the understanding of osteoporotic regulation.

Keywords: Mettl7a; O-GlcNAcylation; extracellular matrix (ECM); m6A methylation; osteoporosis.


Conflict of interest statement

The authors declare no conflict of interest.

Figures
Graphical Abstract
Graphical Abstract
Figure 1.
Figure 1.
Mettl7a overexpression improved the impaired osteogenic capability of OVX-mBMSCs. (A) Immunofluorescence of Prx1, Mettl7a, and nuclei (Dapi) in the femur of osteoporosis mice induced by OVX. Scale bar = 500 μm(left). Scale bar = 50 μm(right). (B) Quantitative analysis of Prx1 and Mettl7a fluorescence intensity from (A). (C) The overexpression efficiency of Flag-Mettl7a in mBMSCs tested by RT-qPCR. (D) The ALP activity analysis in mBMSCs at induced 5 days. (E) ARS staining of mineralized nodules in mBMSCs at induced 14 days. (F) Quantification of calcium deposition from (E). (G) The inhibition efficiency of Mettl7a in mBMSCs tested by RT-qPCR. (H) The ALP activity analysis in mBMSCs at induced 5 days. (I) ARS staining of mineralization in mBMSCs at induced 14 days. (j) Calcium content quantification from (I). (K) Mettl7a expression in sham and OVX-mBMSCs by Real-time RT-PCR. (L) The ALP activity analysis in OVX-mBMSCs after 5-day osteogenic induction. (M) ARS staining at induced 14 days in OVX-mBMSCs. (N) The relative calcium quality of (M). All data represent mean ± SD. Significance determined by Student’s t-test: *P < .05; **P < .01; ***P < .001.
Figure 2.
Figure 2.
Conditional knockout of Mettl7a in mesenchyme cells accelerated bone loss of OVX mice. (A) The genotype of Mettl7a-conditional knockout mice was verified by polymerase chain reaction (PCR). (B) The ALP activity analysis in OVX-mBMSCs after 5-day osteogenic induction. (C) ARS staining after 14-day osteogenic induction in OVX-mBMSCs. (D) The relative calcium quality of (C). (E) The bone microstructure analysis by micro-CT scanning in OVX mice. (F-I) Histomorphometric quantification of femoral bone parameters, including BMD (F), BV/TV (G), Tb.N (H), and Tb.Sp (I). n = 7. (J-K) Representative images of calcein double staining (J) and quantitative analysis of MAR (k) of the cortical bones in OVX mice. n = 7. (L) HE and Masson trichrome staining of the femur of OVX mice. Scale bar = 400 μm (upper). Scale bar = 100 μm(lower). All data represent mean ± SD. Significance determined by Student’s t-test: *P < .05; **P < .01; ***P < .001; ****P < .0001.
Figure 3.
Figure 3.
Mettl7a regulated the expression level and O-GlcNAcylation level of Bsp. (A) A volcano plot of DEPs in mBMSCs between sham and OVX + Vector group. n = 3. (B) A volcano plot of DEPs in mBMSCs between OVX + Vector and OVX + Flag-Mettl7a group. n = 3. (C) The Venn Diagram analysis of overlapping DEPs between (A) and (B), in which the DEPs are associated with osteoporosis and regulated by Mettl7a. (D) Heatmap of overlapping DEPs between (A) and (B), which are associated with osteoporosis and regulated by Mettl7a. (E) KEGG analysis of overlapping DEPs between (A) and (B), which are associated with osteoporosis and regulated by Mettl7a. (F) Proteomic analysis reliability verified by RT-qPCR of Bsp, Tmf1, Yrdc, Saa3, Zdhhc5, Igfbp4. (G) Overall O-GlcNAcylation level, overall Bsp expression level, and O-GlcNAcylated Bsp level in Vector and Flag-Mettl7a group by Co-IP. (H) Immunofluorescence of Rl2 (green), Bsp (red), and nuclei (Dapi, blue) in the femur of OVX Mettl7a f/f and Prx1-cre; Mettl7a f/f mice. Scale bar = 50μm. (I) Quantitative analysis of the relative fluorescence intensity of Rl2 and Bsp from (H). All data represent mean ± SD. Significance determined by Student’s t-test: *P < .05; **P < .01.
Figure 4.
Figure 4.
Mettl7a regulated osteogenic differentiation by targeting the O-GlcNAcylation of Bsp. (A) Co-IP analysis of overall O-GlcNAcylation level, overall Bsp expression level, and O-GlcNAcylated Bsp level in Mettl7af/f, Prx1-cre;Mettl7af/f and Prx1-cre;Mettl7af/f + Thiamet G group to explore the effect of Mettl7a-conditional knockout on the endogenous interaction between the O-GlcNAcylation and Bsp. (B) The ALP activity analysis in mBMSCs after 5-day osteogenic induction. (C) ARS staining after 14-day osteogenic induction in mBMSCs. (D) The relative calcium quality of mBMSCs at induced 14 days. (E) O-GlcNAcylation sites in Bsp predicted by bioinformatic analysis website. (f) The ALP activity analysis in mBMSCs after 5-day osteogenic induction. (g) ARS staining after 14-day osteogenic induction in mBMSCs. (h) The relative calcium quality of mBMSCs at induced 14 days. All data represent mean ± SD. Significance determined by one-way ANOVA analysis: *P < .05; **P < .01; ***P < .001.
Figure 5.
Figure 5.
Mettl7a regulated the expression and O-GlcNAcylation of Bsp through RNA m6A methylation. (A) The effect of Mettl7a-conditional knockout on the RNA m6A methylation level by Dot Blot analysis. (B) Co-IP analysis of overall O-GlcNAcylation level, overall Bsp expression level and O-GlcNAcylated Bsp level in Mettl7af/f, Prx1-cre;Mettl7af/f and Prx1-cre;Mettl7af/f + Betaine group to explore the role of RNA m6A methylation on Mettl7a mediated- interaction between the O-GlcNAcylation and Bsp. (C) Quantitative RT‒qPCR detection of the expression level of Oga. (D) Quantitative RT‒qPCR detection of the expression level of Ogt. (E) The ALP activity analysis in mBMSCs after 5-day osteogenic induction. (F) ARS staining after 14-day osteogenic induction in mBMSCs. (G) The relative calcium quality of mBMSCs at induced 14 days. All data represent mean ± SD. Significance determined by one-way ANOVA analysis: *P < .05; **P < .01; ns indicates no significance.
Figure 6.
Figure 6.
Mettl7a-AAV treatment promoted osteogenesis and alleviated bone loss phenotype in osteoporosis mice. (A) The bone microstructure analysis by micro-CT in the mice tibias. (B-E) Histomorphometric analysis of mice tibias, including BMD (b), BV/TV (C), Tb.N (D) and Tb.Sp (E). n = 6. (f-g) Representative images of calcein double staining (F) and quantitative analysis of relative MAR (G) of the cortical bones in mice tibias. n = 6. (H) HE and Masson trichrome staining of the mice tibias. Scale bar = 400 μm (upper). Scale bar = 100 μm (lower). (I) Immunofluorescence of Rl2, Bsp, and nuclei (Dapi) in the mice tibias. Scale bar = 50 μm. (J) Quantitative analysis of the Rl2 relative fluorescence intensity in (I). (K) Quantitative analysis of the Bsp relative fluorescence intensity in (I). All data represent mean ± SD. Significance determined by one-way ANOVA analysis: *P < .05; **P < .01; ***P < .001; ****P < .0001; ns indicates no significance.
Figure 7.
Figure 7.
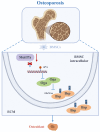
A schematic of Mettl7a in the regulation of osteoporosis by targeting the O-GlcNAcylation of Bsp via m6A. In the context of osteoporosis, the expression of Mettl7a was decreased, which led to the inhibition of m6A methylation within BMSCs. This suppression of methylation stimulated the expression of Oga. Subsequently, Mettl7a regulated the expression and O-GlcNAcylation of Bsp through m6A methylation of Oga, then promoted the differentiation of BMSCs into osteoblasts.

Similar articles

References

    1. Crandall CJ, Larson J, Wright NC, et al. Serial bone density measurement and incident fracture risk discrimination in postmenopausal women. JAMA Intern Med. 2020;180:1232-1240. https://doi.org/ 10.1001/jamainternmed.2020.2986 - DOI - PMC - PubMed
    1. Yong EL, Logan S.. Menopausal osteoporosis: screening, prevention and treatment. Singapore Med J. 2021;62:159-166. https://doi.org/ 10.11622/smedj.2021036 - DOI - PMC - PubMed
    1. Barron RL, Oster G, Grauer A, Crittenden DB, Weycker D.. Determinants of imminent fracture risk in postmenopausal women with osteoporosis. Osteoporos Int. 2020;31:2103-2111. https://doi.org/ 10.1007/s00198-020-05294-3 - DOI - PMC - PubMed
    1. Compston JE, McClung MR, Leslie WD.. Osteoporosis. Lancet. 2019;393:364-376. https://doi.org/ 10.1016/S0140-6736(18)32112-3 - DOI - PubMed
    1. Reid IR, Billington EO.. Drug therapy for osteoporosis in older adults. Lancet. 2022;399:1080-1092. https://doi.org/ 10.1016/S0140-6736(21)02646-5 - DOI - PubMed