Review
. 2025 May 26;15(6):338.
doi: 10.3390/bios15060338.

Biological Barrier Models-on-Chips: A Novel Tool for Disease Research and Drug Discovery

Affiliations
Review

Biological Barrier Models-on-Chips: A Novel Tool for Disease Research and Drug Discovery

Giusi Caragnano et al. Biosensors (Basel). .

Abstract

The development of alternatives to animal models and traditional cell cultures has led to the emergence of organ-on-chip (OoC) systems, which replicate organ functions under both physiological and pathological conditions. These microfluidic platforms simulate key tissue interfaces-such as tissue-air, tissue-liquid, and tissue-tissue interactions-while incorporating biomechanical stimuli to closely resemble in vivo environments. This makes OoC systems particularly suitable for modeling biological barriers such as the skin, the placenta, and the blood-brain barrier, which play essential roles in maintaining homeostasis. This review explores various biological barrier models that can be replicated using the OoC technology, discussing the integration of induced pluripotent stem cells (iPSCs) to advance personalized medicine. Additionally, we examine the methods for assessing barrier formation, including real-time monitoring through integrated sensors, and discuss the advantages and challenges associated with these technologies. The potential of OoC systems in disease modeling, drug discovery, and personalized therapeutic strategies is also highlighted.

Keywords: biological barrier; biosensors; microfluidic platforms; organ-on-chip; personalized medicine.


Conflict of interest statement

The authors declare that they have no known competing financial interests or personal relationships that could have appeared to influence the work reported in this paper.

Figures

Figure 4
Figure 4
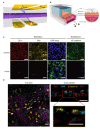
(A) Photograph of the microfluidic device described by Yeste et al. [54]. (B) Three immunofluorescence images from the experiments carried out by Yeste et al. [54]. (C) Schematic representation of the microfluidic device used by Chen et al. [56]. (D,E) Graphs in which the growth area was quantified at different time points in a control situation, in the presence of low glucose concentrations in the culture medium, and after the addition of CoCl2 to enhance hypoxia for the two cell types cultured on the chip [56].
Figure 5
Figure 5
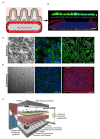
(A) Skin-on-chip image by Sun et al. [62] representing the design of the device and the cellular components inside it. (B), (C) Confocal microscopy images showing (B) the presence of the endothelial microvascular network in the grid and the presence of collagen outside the grid, (C) an enlargement of part of Figure (B), displaying the direction of flow indicated by the white arrows. In both images, the actin filaments are colored in green, and the cell nucleus is in blue (DAPI) (Scale bar 100 µm) [62]. (D) Confocal microscopy image showing infection in the epidermis by herpes simplex virus (HSV) in the skin-on-chip. HSV is shown in green, and the actin filaments are in red (scale bar 20 µm) [62]. (E) Exploded view of the skin-on-chip system realized by Quan et al. [67]. (F) Fluorescence images show the comparison between the expression of filaggrin (FLG) and that of loricrin (stratum corneum proteins) in the static skin equivalent (SE) model and the interface-controlled skin-on-chip (IC-SoC) (scale bar 20 µm) [67].
Figure 7
Figure 7
(A) Schematic representation of the TEER-chip [84]. (B) Drawing of a cross section of the airway chip containing the air–liquid interface (ALI) [87]. (C) Immunofluorescence images showing cell–cell tight junctions containing ZO-1 (red), cilia (yellow) in the epithelium, and VE-cadherin in the endothelium (green) of the airway chip both in the absence (top) and in the presence (bottom) of influenza virus, which expresses green fluorescent protein (GFP) [87]. (D) Immunofluorescence images showing a cross section of the pseudostratified epithelial layer of the human airway with cells expressing cytokeratin 5 (CK-5) in red and beta-tubulin IV in yellow, as well as DAPI in blue and ZO-1 in purple [87] Scale bars 50 um.
Figure 8
Figure 8
(A) Graphic representation of the intestinal villi grown on the membrane of the upper channel and the endothelial lumen formed in the lower channel [102]. (B) Confocal microscope image of a cross section of the artificial intestine inside the platform (bar 100 µm) [102]. (C) DIC image on the left, showing the morphology of the villi of the intestinal epithelium consisting of Caco-2 cells kept in culture for 5 days in the gut-on-chip (bar 50 µm). Centre and right fluorescent microscopy images showing ZO-1 occluding junctions (green, center, bar 50 µm), villin (green, right, bar 100 µm) and the nucleus in blue (DAPI) [102]. (D) Phase-contrast microscopy image of the endothelium kept in culture for 5 days in the gut-on-chip (bar 50 um). Middle and left fluorescence microscopy images show cell junction-associated proteins including PECAM-1 (green, middle, bar 50 micrometers) and VE-cadherin (red, right, 200 um), with nuclei in blue [102]. (E) Drawing of the device by Shah et al., containing a co-culture of human epithelial cells and gastrointestinal tract bacteria [104].
Figure 10
Figure 10
(A) Three-dimensional image of some elements that make up the human placenta. Cross section of the cotyledon, chorionic villus, and anchor villus [119]. (B) Zoom of a cross section showing the fetal capillaries contained in the chorionic villus [119]. Section (C) The placental barrier separates the fetal capillaries from the maternal intervillous space and consists of the endothelial cells of the fetal capillaries, a layer of interstitial tissue, and the syncytiotrophoblast [119]. (D) On the right, image of a fetus inside the placenta, connected to it via the umbilical cord. On the left, schematic representation of a part of the placenta, showing maternal blood vessels, chorionic villi, intervillous space, fetal blood vessels, and umbilical cord [124].
Figure 11
Figure 11
(A) Photo of the micro-engineered model representing the placenta-on-chip [119]. (B) Picture of the device realized by Zhu et al. on the left, and enlarged cross section of the chip on the right [127]. (C) Graph illustrating a quantitative real-time PCR showing the relative expression of inflammatory cytokines with and without E. coli. * p < 0.05, *** p < 0.001 [127].
Figure 1
Figure 1
Schematic overview of the various biological barriers on chips described in this work.
Figure 2
Figure 2
(A) Schematic representation of the horizontal section of the BBB-on-chip [49]. (B,C) Confocal microscopy images of untreated (a,b,e,f) and D-mannitol-treated (c,d,g,h) BBB after 24 h. Immunochemical staining was performed on the membrane, showing pericytes and endothelial cells (eh) and endothelial cells alone (ad). Nuclei are stained in blue, ZO-1 tight junctions are stained in green, and VE (vascular endothelial)–cadherin adherens junctions are stained in red. Scale bars: 100 µm for 20× images and 50 µm for 63× images [49]. (D) Chip design by Xu et al. [50]. (E) TEER measurements of barrier function in the BBB group and brain microvascular endothelial cells (BMECs) under static and flow conditions [50]. (F) 3D BBB model by Partyka et al. [51]. (G) Representation of fluid flow, cyclic deformation, and TEER measurements in the BBB-on-chip [51].
Figure 3
Figure 3
Schematic representation of the inner and outer blood–retinal barrier components. ILM: inner limiting barrier, GCL: ganglion cell layer, INL: outer nuclear layer, OS: outer segments [49].
Figure 6
Figure 6
(A) Graphic representation of the cornea-on-chip by Yu et al. [75]. (B) Graphs of TEER readings (left) and measurements of the permeability coefficient (right) of the corneal epithelium in three different conditions [75]. (C) Image of the eye-on-chip by Seo et al. [76]. (D) Fluorescence microscope images showing corneal epithelial cells grown under three different conditions: at the air–liquid interface (ALI), with ALI + 24 h of simulated blinking and ALI + 48 h of simulated blinking, to simulate the environment of the organ in vivo (Scale bar 20 µm) [76].
Figure 9
Figure 9
(A) Sketch representation of the testis-on-chip device developed by Sharma et al. [107]. (B) Images (a) to (d) are from light microscopy and show the maintenance of tissue integrity in the chip up to day 11. Images (e) to (h) show a live/dead assay, with calcein (green) highlighting live cells, and propidium iodide (red) indicating dead cells. This assay was used to highlight cell viability in the primate seminiferous tubules on the chip [107]. (C) Bottom view of the multi-organ platform including liver and testes by Baert et al. [114].

Similar articles

References

    1. Arik Y.B., van der Helm M.W., Odijk M., Segerink L.I., Passier R., van den Berg A., van der Meer A.D. Barriers-on-chips: Measurement of barrier function of tissues in organs-on-chips. Biomicrofluidics. 2018;12:042218. doi: 10.1063/1.5023041. - DOI - PMC - PubMed
    1. Zoio P., Lopes-Ventura S., Oliva A. Barrier-on-a-Chip with a Modular Architecture and Integrated Sensors for Real-Time Measurement of Biological Barrier Function. Micromachines. 2021;12:816. doi: 10.3390/mi12070816. - DOI - PMC - PubMed
    1. Cary C., Stapleton P. Determinants and mechanisms of inorganic nanoparticle translocation across mammalian biological barriers. Arch. Toxicol. 2023;97:2111–2131. doi: 10.1007/s00204-023-03528-x. - DOI - PMC - PubMed
    1. Nazari H., Shrestha J., Naei V.Y., Bazaz S.R., Sabbagh M., Thiery J.P., Warkiani M.E. Advances in TEER measurements of biological barriers in microphysiological systems. Biosens. Bioelectron. 2023;234:115355. doi: 10.1016/j.bios.2023.115355. - DOI - PubMed
    1. Kulkarni M.B., Reed M.S., Jiang S.D., Cao X., Hasan T., Doyley M.M., Pogue B.W. Prototype dual-channel fluorescence/transmission optical tomography system for quantification of capillary permeability and porphyrin production; Proceedings of the SPIE BiOS; San Francisco, CA, USA. 12 March 2024; - DOI

LinkOut - more resources