. 2025 Jun 10;14(12):877.
doi: 10.3390/cells14120877.

Inorganic Arsenite [As (III)] Represses Human Renal Progenitor Cell Characteristics and Induces Neoplastic-like Transformation

Affiliations

Inorganic Arsenite [As (III)] Represses Human Renal Progenitor Cell Characteristics and Induces Neoplastic-like Transformation

Md Ehsanul Haque et al. Cells. .

Abstract

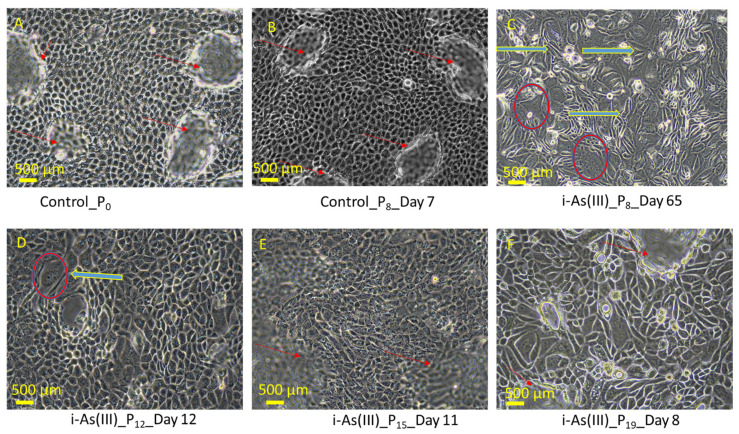
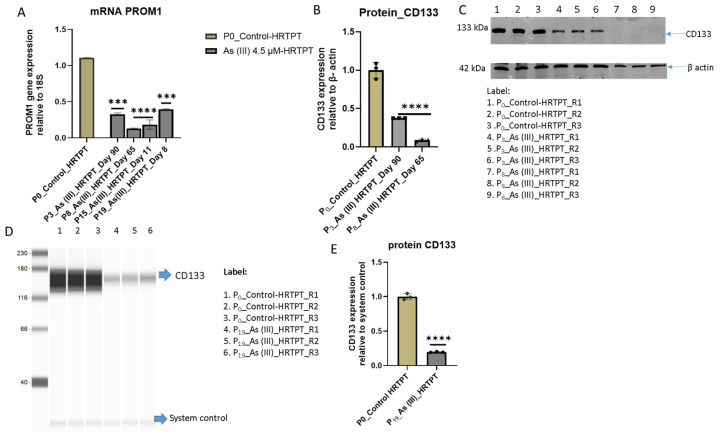
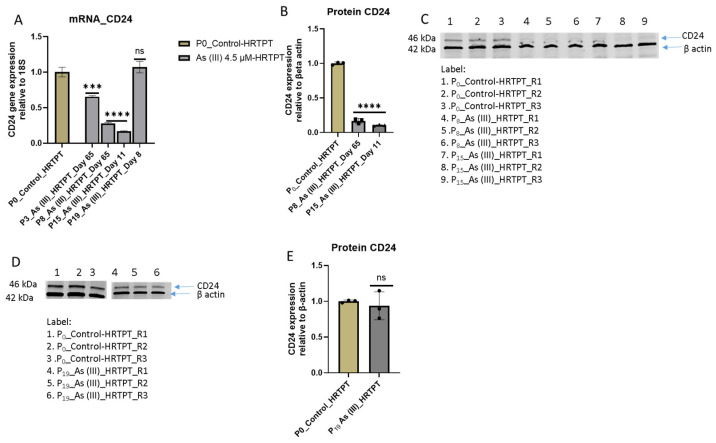
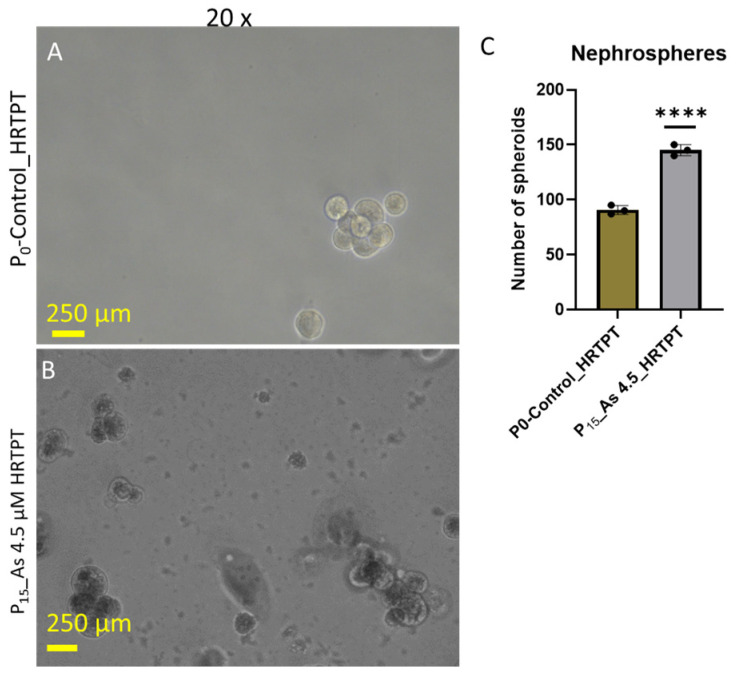
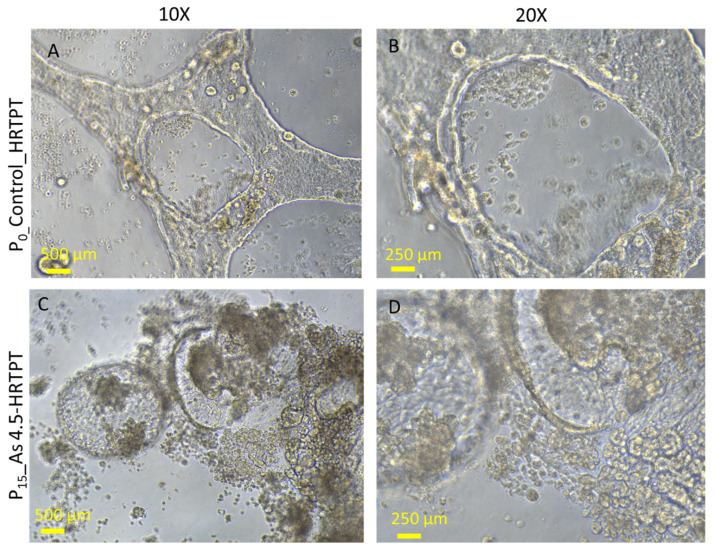
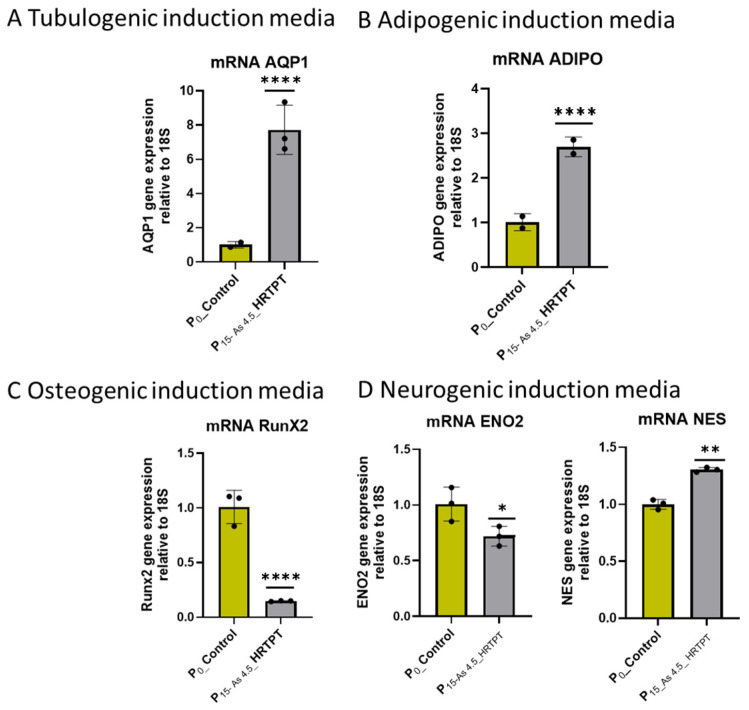
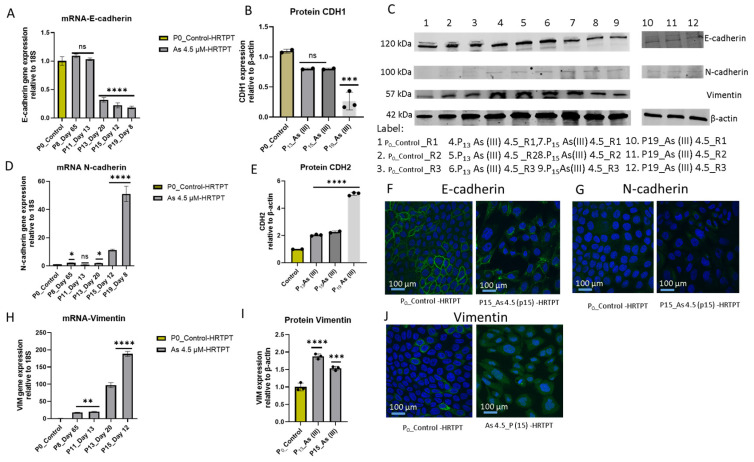
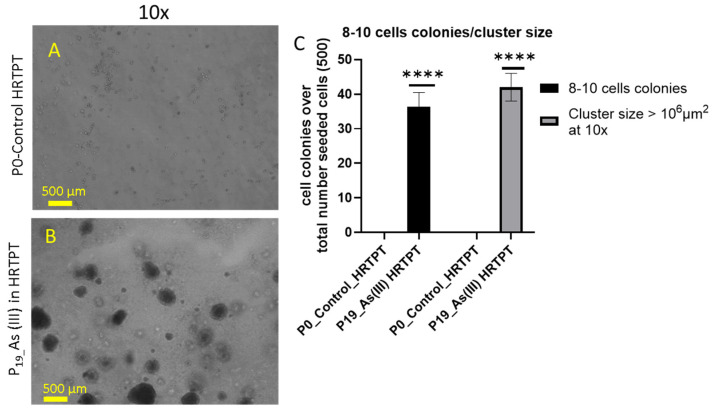
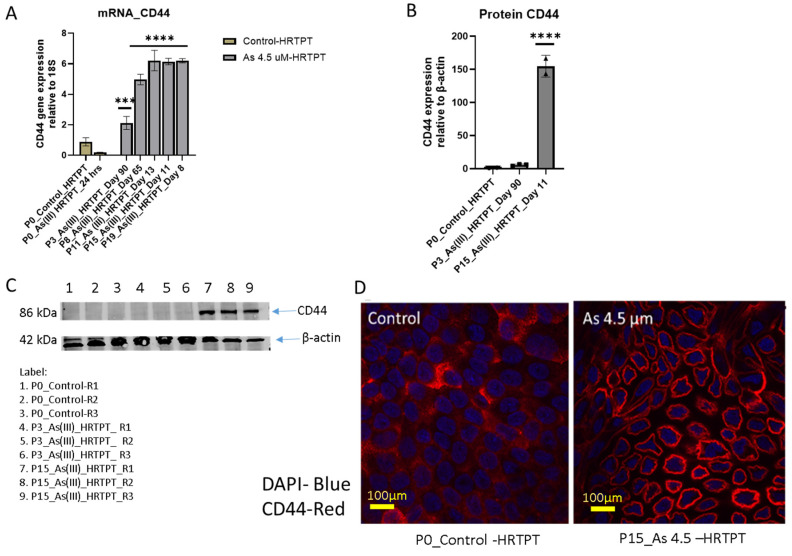
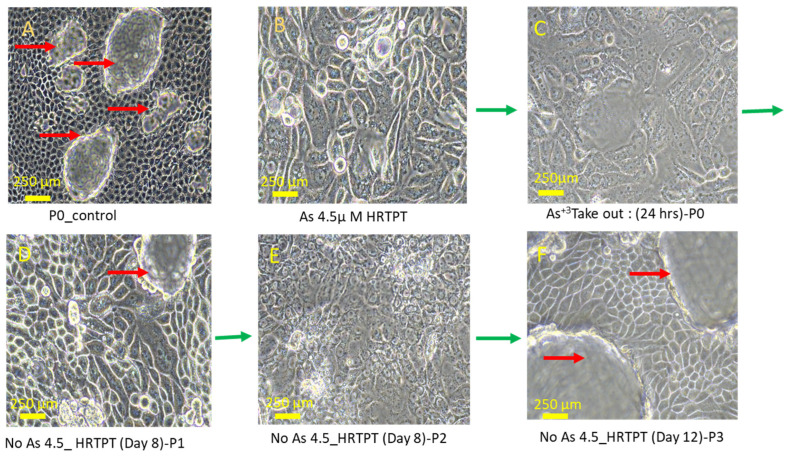
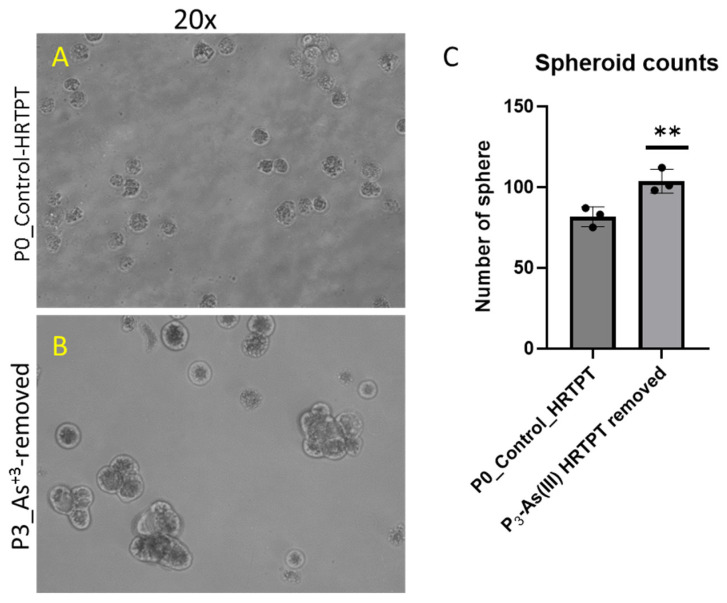
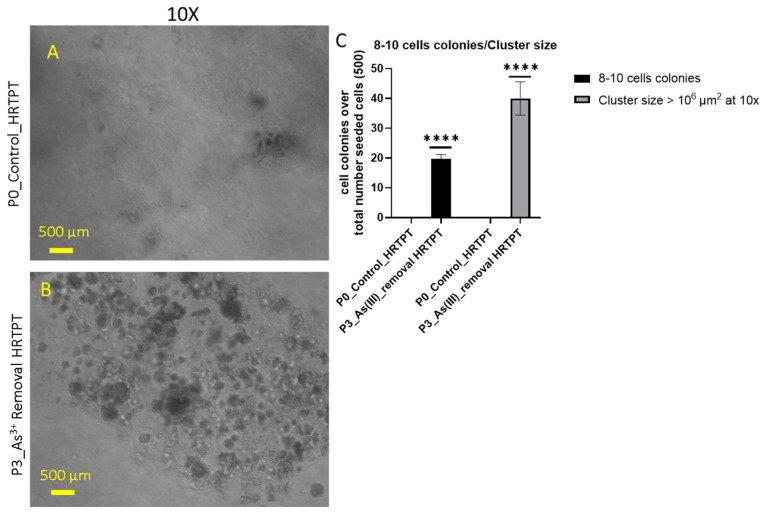
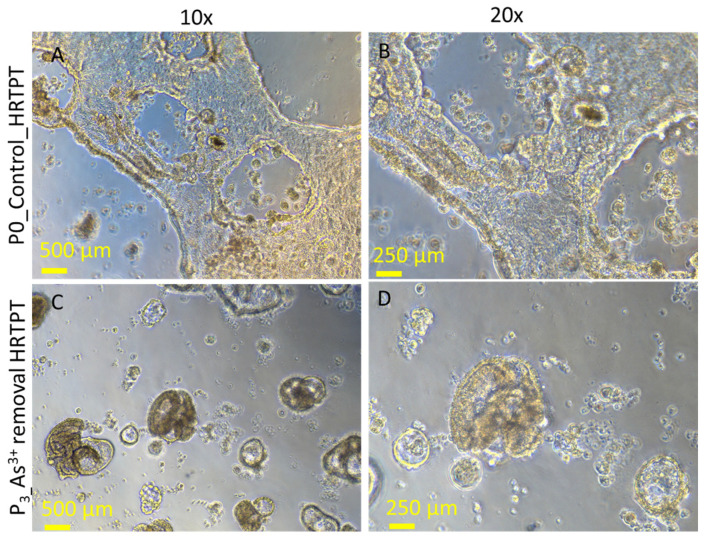
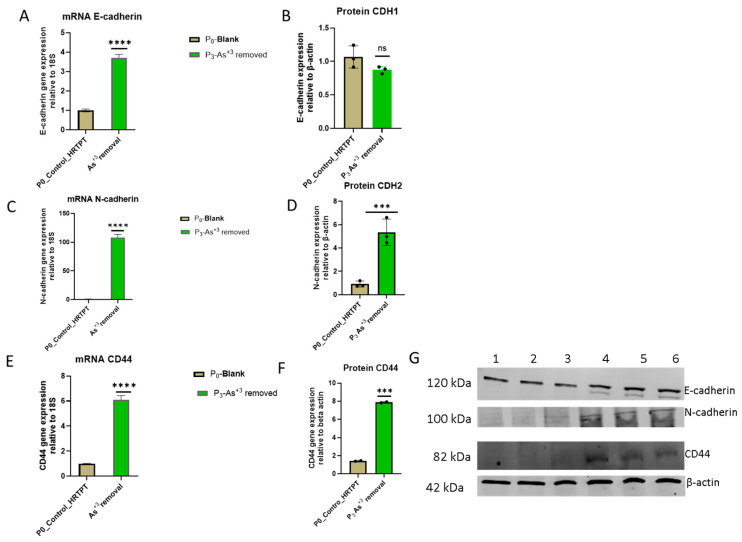
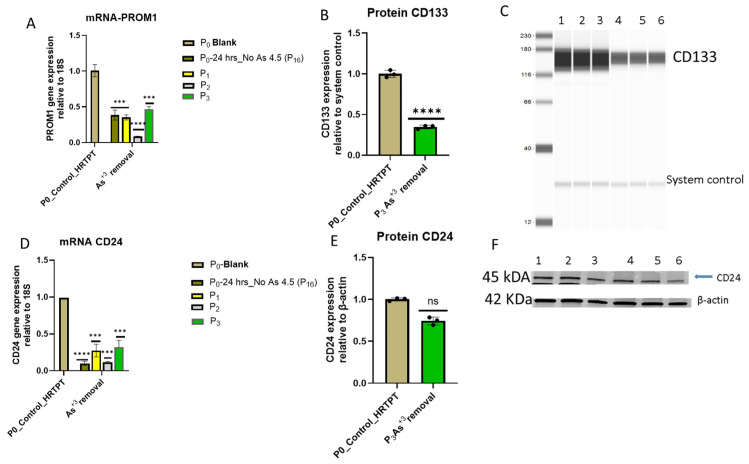
Arsenic, in the form of inorganic arsenite, is toxic to the kidney and can cause acute kidney injury, manifesting as destruction of proximal tubule cells. Nephron repair is possible through the proliferation of resident tubular progenitor cells expressing CD133 and CD24 surface markers. We simulated regenerative repair in the continued presence of i-As (III) using a cell culture model of a renal progenitor cell line expressing CD133 (PROM1) and CD24. Continued exposure and subculturing of progenitor cells to i-As (III) led to a reduction in the expression of PROM1 and CD24, as well as a decrease in the ability to differentiate into tubule-like structures. Cessation of i-As (III) and recovery for up to three passages resulted in continued repression of PROM1 and reduced ability to differentiate. Chronically exposed cells exhibited an ability to form colonies in soft agar, suggesting neoplastic transformation. Chronically exposed cells also exhibited an induction of CD44, a cell surface marker commonly found in renal cell carcinoma, as well as in tubular repair in chronic renal injury such as chronic kidney disease. These results demonstrate potential adverse outcomes of renal progenitor cells chronically exposed to a nephrotoxicant, as well as in environmental exposure to arsenic.

Keywords: CD44; HRTPT; RCC; arsenite; kidney progenitor.


Conflict of interest statement

The authors declare no conflicts of interest.

Figures

Figure 1
Figure 1
Light microscopic images of HRTPT cells exposed to 4.5 µM of arsenite show EMT-like morphological change at passage at P8; (A) (Control_P0) and (B) (Control_P8_Day 7) are controls-unexposed cells; (C) (P8-i-As3+_Day 12), (D) (P12-i-As3+_Day 11), (E) (P15-i-As3+ _Day11), (F) (P19-i-As3+_Day8) cells exposed to 4.5 µM of arsenite passaged up to P20 (including P0-24 h of arsenite exposure) and grown in 1:1 DMEM/F12 media. Red arrows show dome-like structures, blue arrows show fibroblast-like structures, and red circles show myofibroblast-like cells, scale bar = 500 µm and magnification × 20.
Figure 2
Figure 2
mRNA and protein level of PROM1 in HRTPT cell lines treated with 4.5 µM of i-As up to P19 passages. (A) mRNA PROM1-RT-qPCR analysis, (B) protein CD133 analysis (quantification from image C), (C) Western blot, (D) capillary Western/Jess of CD133, (E) protein CD133 analysis (quantification from image D); the expression of the PROM1 gene was normalized to the 18S housekeeping gene. While the expression of the CD133 protein was normalized to β-actin in the Western blot and to the system control in the capillary Western. Protein expression in (D) was also normalized to the Jess system control. The measurements were performed in triplicate for gene and protein data. The reported values are mean ± SEM. A one-way ANOVA was performed, and **** and *** indicate significant differences in gene/protein expression level compared to the control (0.0 µM arsenite concentration at p-value of ≤0.0001; ≤0.001, respectively).
Figure 3
Figure 3
mRNA and protein level of CD24 in HRTPT cell lines treated with 4.5 µM of i-As (III) up to P19 passages. (A) mRNA_CD24-RT-qPCR analysis, (B,E) protein analysis of CD24, (C,D) Western blot of CD24 The expression of the CD24 gene and the protein were normalized to the 18S housekeeping gene and β-actin, respectively. The measurements were performed in triplicate for gene and protein data. The reported values are mean ± SEM. A one-way ANOVA was performed, and **** and *** indicate significant differences in gene/protein expression level compared to the control (0.0 µM arsenite concentration at p-value of ≤0.0001; ≤0.001, respectively). “ns” indicates non-significant.
Figure 4
Figure 4
Light-level microscopy of spheroids generated from –Control-HRTPT, i-As (III) 4.5 µM-HRTPT (P15) cells. The spheroid images taken at 20× magnification were generated from (A) Control-HRTPT cells and (B) i-As 4.5 µM HRTPT (P15) cells. (C) Bar graph shows the number of sphere counts; the measurements were performed in triplicate for control and As (III)-exposed cells. The reported values are mean ± SEM. A t-test was performed, and asterisks indicate significant differences from the control (**** p < 0.0001). All the images were taken after 21 days of seeding in the ultra-low attachment flasks.
Figure 5
Figure 5
Light-level microscopy of Control-HRTPT and i-As (III) 4.5 µM-HRTPT (P15) cells plated on the surface of a thin Matrigel-coated 48-well plate. (A,B) HRTPT control; (C,D) As 4.5 µM-HRTPT-P15 grown on the surface of the Matrigel coat. All images were taken at 10× and 20× magnification.
Figure 6
Figure 6
mRNA level of cell-type-specific differentiation markers in Control-HRTPT and P15-As 4.5 µM HRTPT. (A) mRNA_AQP1 (tubulogenic cell differentiation marker)-RT-qPCR analysis and (B) mRNA-ADIPO (adipogenic cell differentiation marker)-RT-qPCR analysis, (C) mRNA RunX2 (osteogenic induction marker)-RT-qPCR analysis, (D) mRNA_NES and ENO2 (neurogenic cell differentiation marker). Gene expression was normalized to the 18S housekeeping gene. The measurements were performed in triplicate for gene data. The reported values are mean ± SEM. A t-test was performed, and asterisks indicate significant differences from the control (* p < 0.05, ** p < 0.01, **** p < 0.0001).
Figure 7
Figure 7
mRNA and protein levels of EMT markers in HRTPT cell lines exposed to 4.5 µM of i-As up to P19 passages. (A) mRNA_E-cadherin; (B) protein_CDH1; (C) Western blot results confirmed protein level expression; (D) mRNA_N-cadherin; (E) protein_CDH2; (H) mRNA Vimentin; (I) protein vimentin, RT-qPCR and Western blot analysis for protein; ****; ***; **; * indicate significant differences in protein expression level compared to the control 0.0 µM arsenite concentration at p-value of ≤0.0001; ≤0.001; ≤0.01; ≤0.05, respectively. Immunofluorescence of CDH1 (F), CDH2 (G), and Vimentin (J) in HRTPT cell line exposed to 4.5 µM of As (III) (P15); (F) CDH1 expression of control vs. As (III) (P15); (G) CDH2 expression of control vs. As+3(P15); Vimentin expression of control vs. i-As (III) (P15); green represents the expression of CDH1/CDH2/Vim, and blue represents DAPI.
Figure 8
Figure 8
Light-level microscopy of Control-HRTPT and chronic As (III)-exposed cells (P19) plated on a soft agar plate up to 28 days. (A) HRTPT control; (B) chronic i-As (III)-exposed cells grown on soft agar. (C) t-test for control vs. P19 i-As+3; 8–10 cell colonies and cluster size > 106 μm2. The reported values are mean ± SEM. A t-test was performed, and asterisks indicate significant differences from the control (**** p < 0.0001). Images were taken at 10× magnification at 28 days after seeding.
Figure 9
Figure 9
mRNA and protein level of CD44 markers in HRTPT cell lines exposed to 4.5 µM of i-As (III) up to P19 passages. (A) mRNA_CD44-RT-qPCR analysis; (B,C) protein_CD44-Western analysis; (D) immunofluorescence of CD44 control vs i-As (III)-exposed cells (P15); expression of the CD44 gene and the protein was normalized to the 18S housekeeping gene and β-actin, respectively. The measurements were performed in triplicate for gene and protein data. The reported values are mean ± SEM. A one-way Anova was performed, and **** and *** indicate significant differences in gene/protein expression level compared to the control (0.0 µM arsenite concentration at p-value of ≤0.0001; ≤0.001, respectively).
Figure 10
Figure 10
Light microscopic images of As3+-removed HRTPT cells from i-As (III)-exposed cells; (A) unexposed control; (B) i-As (III)-exposed HRTPT cells; (C) i-As (III)-removed cells for 24 h (P0); (D) P1 i As (III)-removed cells; (E) P2 i-As (III)-removed cells; (F) P3 i-As (III)-removed cells. The green arrow indicates images of i-As (III)-removed passages; scale bar = 500 µm and magnification 20×. Red arrows show the presence of domes, and green arrows show the chronology of arsenic removal from chronic arsenite-exposed cells (BF).
Figure 11
Figure 11
Light-level microscopy of spheroids generated from control-HRTPT and P3 i-As (III)-removed-HRTPT cells. The spheroid images taken at 20× magnification generated from (A) control-HRTPT cells; (B) P3_i-As (III)-removed-HRTPT cells; and (C) bar graph shows number of sphere; ** indicates significant differences in number of spheres compared to the control (0.0 µM arsenite concentration at p-value of ≤ 0.01). All the images were taken after 28 days of seeding in the ultra-low attachment flasks.
Figure 12
Figure 12
Light-level microscopy of control-HRTPT and P3_i-As (III)-removed cells plated on a soft agar plate up to 28 days. (A) HRTPT control; (B) P3_i-As (III)-removed cells grown on soft agar. (C) t-test for control vs. As (III)-removed cells; 8–10 cell colonies, and cluster size > 106 μm2. The reported values are mean ± SEM. A t-test was performed, and asterisks indicate significant differences from the control (**** p < 0.0001). Images were taken at 10× magnification at 28 days after seeding. All images were taken at 10× magnification at 28 days after seeding.
Figure 13
Figure 13
Light-level microscopy of control-HRTPT and P3 i-As (III)-removed cells plated on the surface of a thin Matrigel-coated 48-well plate. (A,B) HRTPT control; (C,D) P3 i-As (III)-removed cells grown on the surface of the Matrigel coat. All images were taken at 10× and 20× magnification.
Figure 14
Figure 14
mRNA and protein level of EMT markers in HRTPT cell lines after removal of arsenite vs. non-I-As (III) exposure control. (A) mRNA_E-cadherin-RT-qPCR analysis and (B,G) protein_CDH1–Western blot analysis, (C) mRNA_N-cadherin-RT-qPCR analysis (D,G) protein_CDH2-Western blot analysis, (E) mRNA_CD44-RT-qPCR analysis (F,G) protein_CD44-Western blot analysis. Gene expression was normalized to the 18S housekeeping gene. The measurements were performed in triplicate for gene data. The reported values are mean ± SEM. A t-test was performed for mRNA and protein, respectively. Asterisks indicate significant differences from the control (*** p < 0.001, **** p < 0.0001). “ns” indicates non-significant.
Figure 15
Figure 15
mRNA and protein level of progenitor markers in HRTPT cell lines after removal of arsenite vs. non-arsenite exposure. (A) mRNA_CD133- RT-qPCR analysis and (B,C) protein_CD133 -Jess analysis; (D) mRNA_CD24- RT-qPCR analysis; (E,F) protein_CD24-Western blot analysis; gene expression was normalized to the 18S housekeeping gene. The measurements were performed in triplicate for gene data. The reported values are mean ± SEM. A one-way ANOVA and t-test were performed for mRNA and protein, respectively. Asterisks indicate significant differences from the control (*** p < 0.001, **** p < 0.0001). “ns” indicates non-significant.

Similar articles

References

    1. Fatoki J.O., Badmus J.A. Arsenic as an environmental and human health antagonist: A review of its toxicity and disease initiation. J. Hazard. Mater. Adv. 2022;5:100052. doi: 10.1016/j.hazadv.2022.100052. - DOI
    1. Ayotte J.D., Medalie L., Qi S.L., Backer L.C., Nolan B.T. Estimating the High-Arsenic Domestic-Well Population in the Conterminous United States. Environ. Sci. Technol. 2017;51:12443–12454. doi: 10.1021/acs.est.7b02881. - DOI - PMC - PubMed
    1. Nordstrom D.K. An Overview of Arsenic Mass-Poisoning in Bangladesh and West Bengal, India. Society for Mining, Metallurgy, and Exploration; Englewood, CO, USA: 2000. [(accessed on 25 January 2025)]. Available online: https://pubs.usgs.gov/publication/70198882.
    1. Cohen S.M., Arnold L.L., Eldan M., Lewis A.S., Beck B.D. Methylated arsenicals: The implications of metabolism and carcinogenicity studies in rodents to human risk assessment. Crit. Rev. Toxicol. 2006;36:99–133. doi: 10.1080/10408440500534230. - DOI - PubMed
    1. Hughes M.F., Beck B.D., Chen Y., Lewis A.S., Thomas D.J. Arsenic exposure and toxicology: A historical perspective. Toxicol. Sci. 2011;123:305–332. doi: 10.1093/toxsci/kfr184. - DOI - PMC - PubMed