. 2025 Jun 13;14(12):893.
doi: 10.3390/cells14120893.

Ectopic ULBP2 Is Associated with Decreased NKG2D Expression in CD8+ T Cells Under T Cell-Modulatory Conditions in a Murine Tumor Model

Affiliations

Ectopic ULBP2 Is Associated with Decreased NKG2D Expression in CD8+ T Cells Under T Cell-Modulatory Conditions in a Murine Tumor Model

Yasuhiko Teruya et al. Cells. .

Abstract

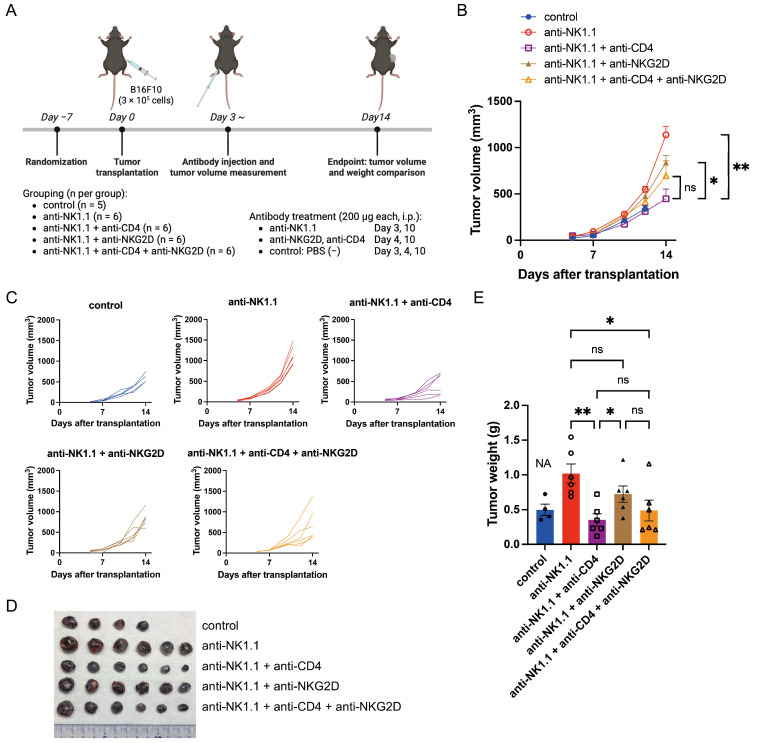
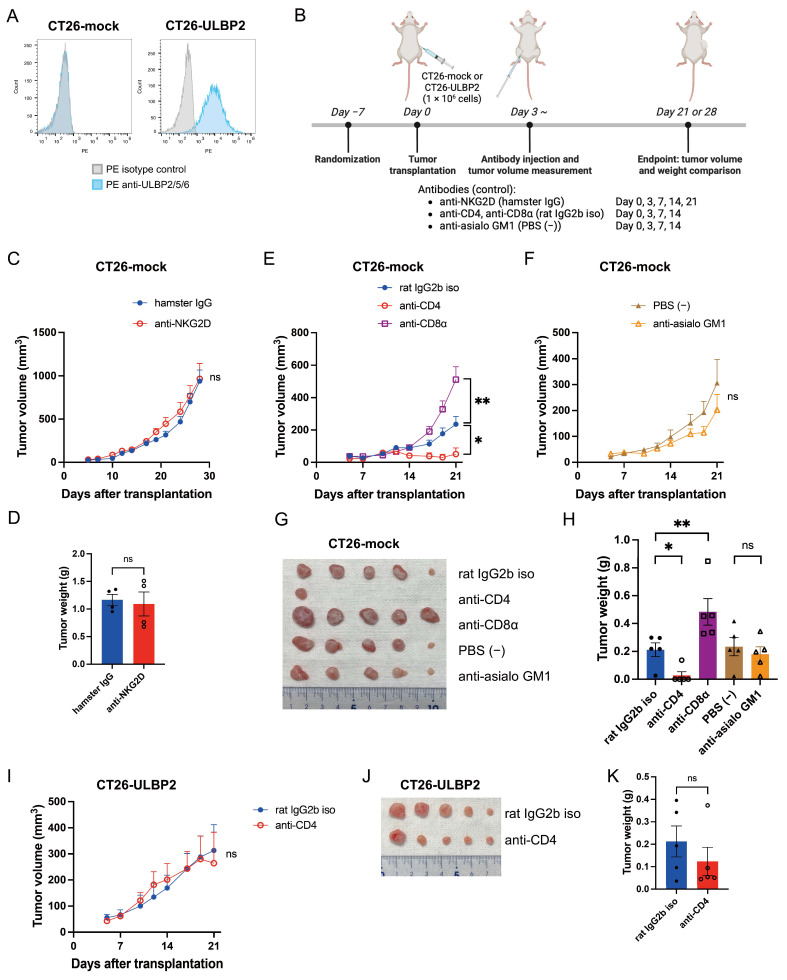
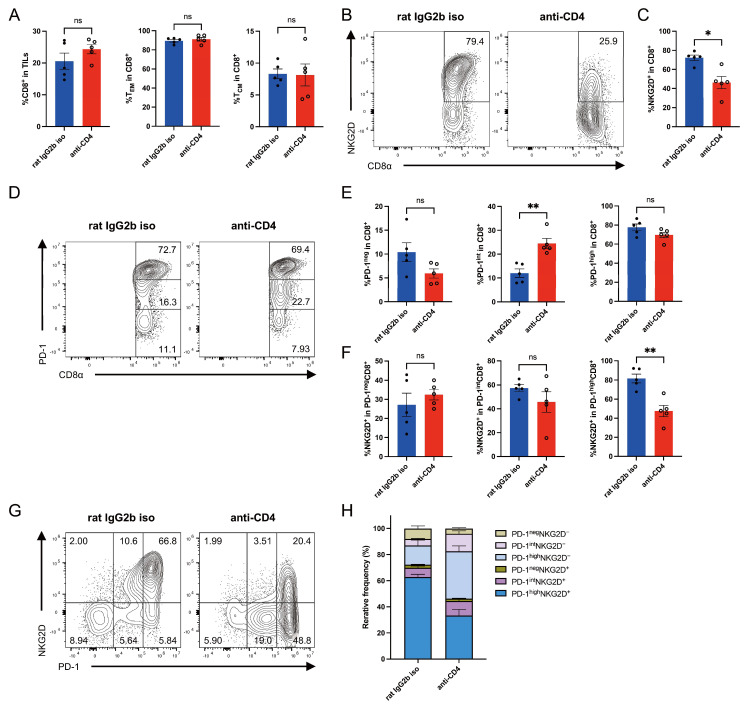
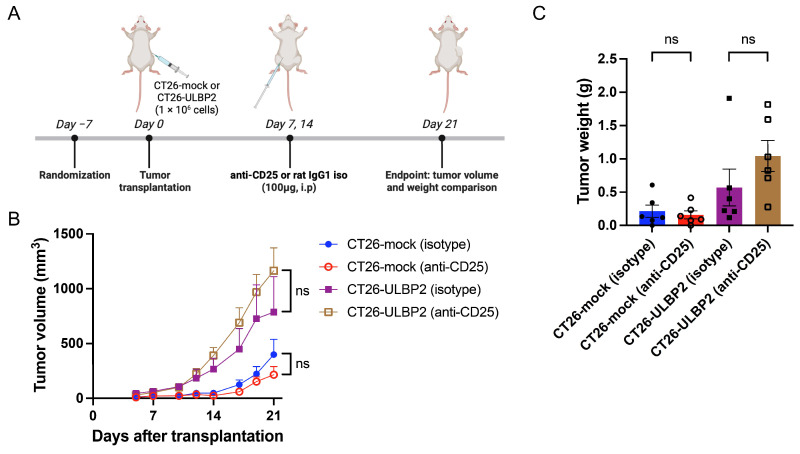
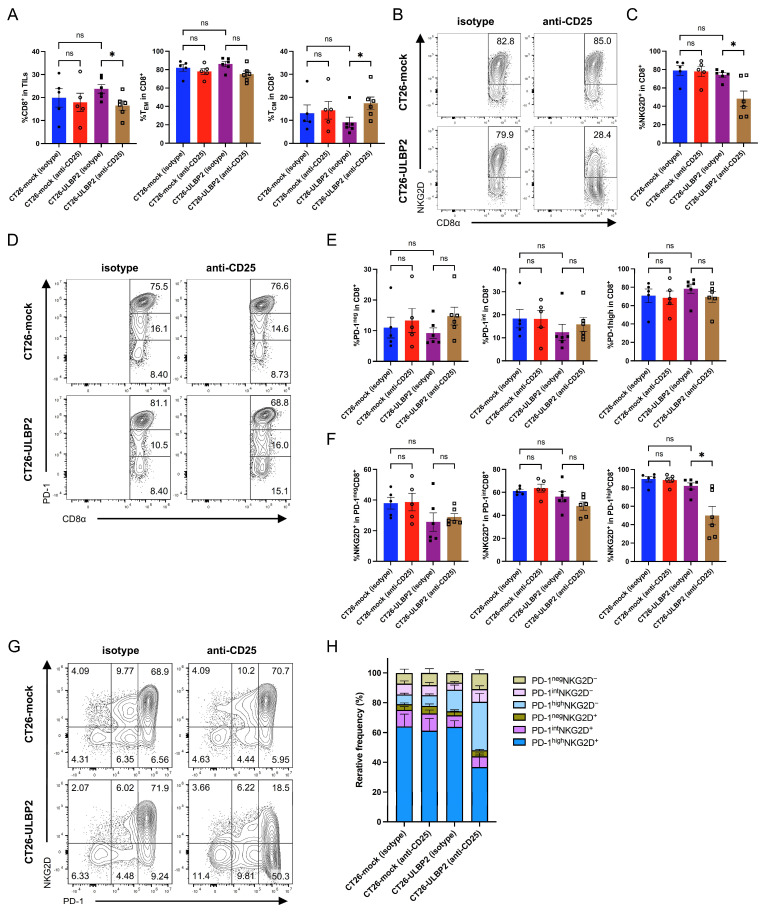
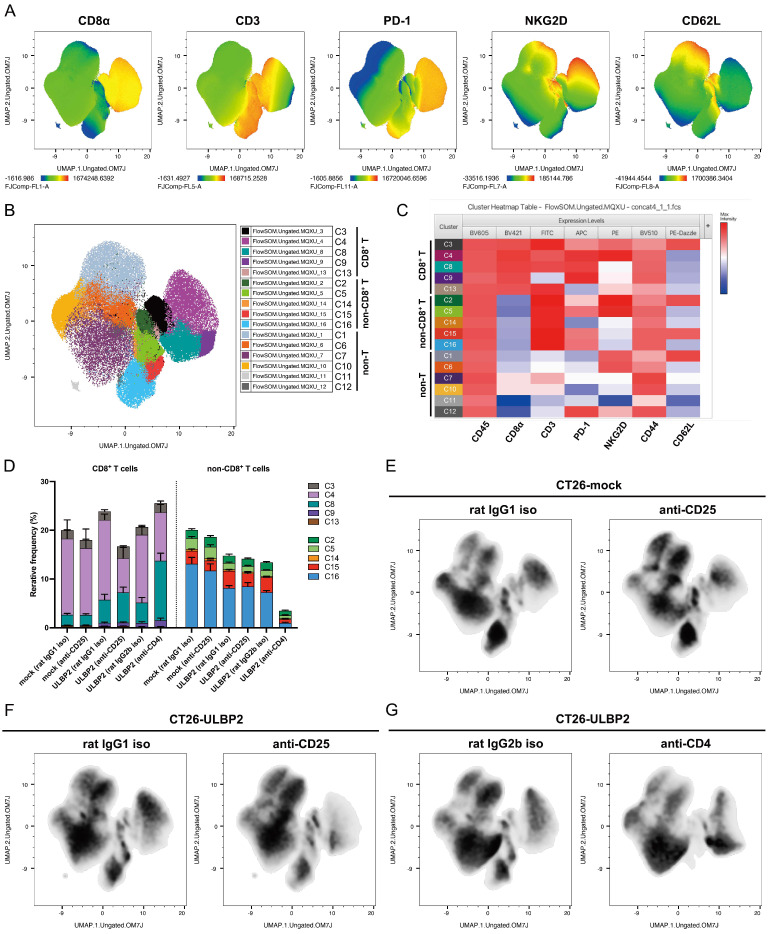
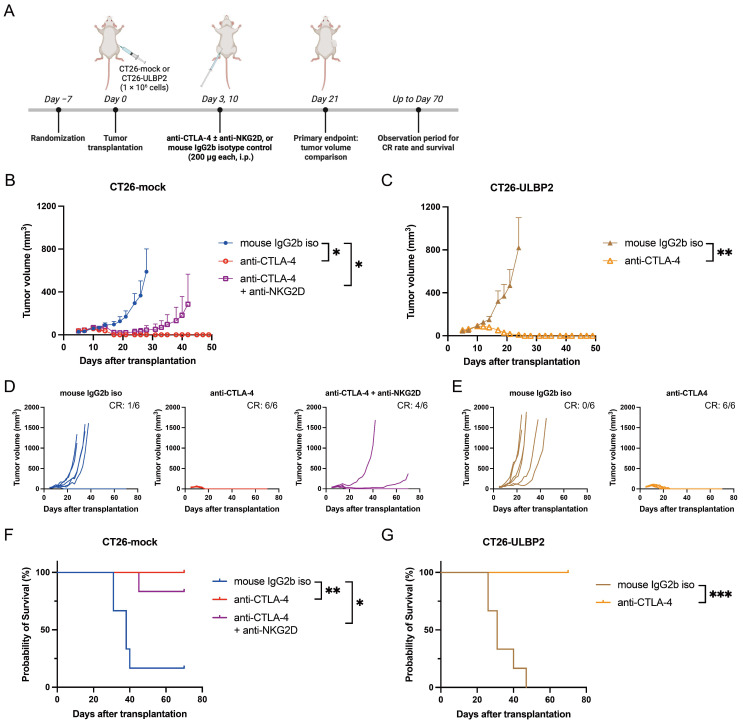
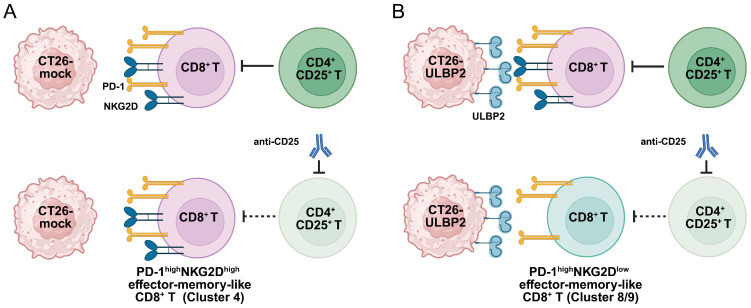
UL16-binding protein 2 (ULBP2), a ligand for the activating receptor NKG2D, plays a dual role in tumor immunity, promoting immune activation or suppression, depending on the context. To investigate its impact on CD4+CD25+ T cell-targeted immunotherapies, we used a syngeneic CT26 colon cancer model engineered to express ULBP2 and compared tumor growth and tumor-infiltrating lymphocyte (TIL) profiles in control and ULBP2-expressing tumors treated with anti-CD4, anti-CD25, or anti-CTLA-4 antibodies. Tumor growth was uniformly assessed on day 21 post-transplantation, and TIL analysis was performed in groups with evaluable residual tumors. Anti-CD4 antibody significantly suppressed tumor growth in mock-transfected tumors, while no significant suppression was observed in ULBP2-expressing tumors. Anti-CD25 antibody had limited efficacy in mock tumors and tended to promote tumor growth in ULBP2-expressing tumors. Following these treatments, ULBP2 expression was associated with reduced NKG2D expression in CD8+ effector memory T cells, particularly PD-1high subsets. In contrast, anti-CTLA-4 antibody treatment induced marked tumor regression irrespective of ULBP2 expression. These findings suggest that ULBP2-NKG2D signaling may contribute to altered CD8+ T cell phenotypes under T cell-modulatory conditions, potentially impacting the outcome of CD4+CD25+ T cell-targeted therapies and providing insights for optimizing immunotherapeutic strategies.

Keywords: CD4+ T cell depletion; CD4+ T cells; NK cells; NKG2D; NKG2D ligands; Treg; ULBP2; cancer immunotherapy; immune checkpoint inhibitor; tumor immunology.


Conflict of interest statement

The authors declare no conflicts of interest.

Figures

Figure 1
Figure 1
CD4+ T cell depletion suppresses tumor growth in B16F10 tumors under NK cell-depleted conditions. (A) Schematic of the experimental design. Six-week-old female C57BL/6 mice were randomly assigned to the following treatment groups: PBS (−) control, anti-NK1.1 antibody, anti-NK1.1 + anti-CD4 antibodies, anti-NK1.1 + anti-NKG2D antibodies, or anti-NK1.1 + anti-CD4 + anti-NKG2D antibodies (n = 6 per group, except PBS (−) control, n = 5). After a 1-week acclimatization period, wild-type B16F10 cells (3 × 10⁵) were subcutaneously transplanted into the right flank. Anti-NK1.1 antibody was administered intraperitoneally (i.p.) on days 3 and 10, and anti-CD4 and anti-NKG2D antibodies were administered on days 4 and 10 (200 μg/mouse each). Created with BioRender.com. (BE) Average tumor growth curves (B), individual tumor growth curves (C), photographs of all excised tumors on day 14 post-transplantation (D), and tumor weights on day 14 post-transplantation (E) in each treatment group. The PBS (−) control group was excluded from statistical analysis due to the death of one mouse on day 13; “NA” in (E) indicates this exclusion (NA, not applicable). In (B,E), markers represent treatment groups as follows: filled circles, PBS (−) control; open circles, anti-NK1.1 antibody; open squares, anti-NK1.1 + anti-CD4 antibodies; filled triangles, anti-NK1.1 + anti-NKG2D antibodies; and open triangles, anti-NK1.1 + anti-CD4 + anti-NKG2D antibodies. In (B), data are presented as mean ± standard error of mean (SEM); in (E), individual values are shown with mean ± SEM. * p < 0.05; ** p < 0.01; ns, not significant (Mann–Whitney U test).
Figure 2
Figure 2
ULBP2 expression reduces the efficacy of CD4+ T cell depletion in CT26 tumors. (A) Flow cytometric histograms of CT26-mock and CT26-ULBP2 cells stained with PE-conjugated anti-ULBP2/5/6 antibody or PE isotype control antibody. (B) Schematic of the experimental design. Six-week-old female BALB/c mice were randomly assigned to different treatment groups. After a 1-week acclimatization period, CT26-mock or CT26-ULBP2 cells (1 × 10⁶) were subcutaneously transplanted into the right flank. Created with BioRender.com. (C,D) Tumor growth curves (C) and tumor weights on day 28 post-transplantation (D) in BALB/c mice bearing CT26-mock tumors treated with anti-NKG2D antibody or isotype control antibody (n = 4 per group). Antibodies were administered i.p. at 300 μg/mouse on day 0 post-transplantation and 200 μg/mouse on days 3, 7, 14, and 21 post-transplantation. (EH) Tumor growth curves (E,F), representative tumor photographs on day 21 post-transplantation (G), and tumor weights on day 21 post-transplantation (H) in CT26-mock tumor-bearing mice treated with specific depleting antibodies, isotype control antibodies, or PBS (−) (n = 5 per group). Antibodies were administered i.p. at 300 μg/mouse on day 0 post-transplantation and 200 μg/mouse on days 3, 7, and 14 post-transplantation; anti-asialo GM1 antibody alone was administered at 20 μL/mouse on days 0, 3, 7, and 14 post-transplantation. (IK) Tumor growth curves (I), representative tumor photographs (J), and tumor weights on day 21 post-transplantation (K) in CT26-ULBP2 tumor-bearing mice treated with anti-CD4 antibody or isotype control antibody. Antibodies were administered i.p. at 300 μg/mouse on day 0 post-transplantation and 200 μg/mouse on days 3, 7, and 14 post-transplantation (n = 5 per group). Marker shapes represent treatment groups as follows: In (C,D): filled circles, hamster IgG; open circles, anti-NKG2D antibody. In (E,F,H): filled circles, rat IgG2b isotype control antibody; open circles, anti-CD4 antibody; open squares, anti-CD8α antibody; filled triangles, PBS (−) control; open triangles, anti-asialo GM1 antibody. In (I,K): filled circles, rat IgG2b isotype control antibody; open circles, anti-CD4 antibody. In (C,E,F,I), data are presented as mean ± SEM; in (D,H,K), individual values are shown with mean ± SEM. * p < 0.05; ** p < 0.01; ns: not significant (Mann–Whitney U test).
Figure 3
Figure 3
CD4+ T cell depletion reduces NKG2D expression on intratumoral CD8+ T cells in CT26-ULBP2 tumors. Tumors were harvested on day 21 post-transplantation from CT26-ULBP2 tumor-bearing mice treated with anti-CD4 antibody or isotype control antibody, as described in Figure 2I–K. Five tumors per group were analyzed. (A) Percentages of CD8+ T cells among CD45+ lymphocytes and of effector memory (TEM) and central memory (TCM) subsets among CD8+ T cells. (B,C) Representative flow cytometry plots (B) and quantification (C) of the percentage of NKG2D+ cells among CD8+ T cells. (D,E) Representative plots (D) and quantification (E) of the percentages of PD-1neg, PD-1int, and PD-1high subsets among CD8+ T cells. (F) Percentages of NKG2D+ cells within PD-1neg, PD-1int, and PD-1high subsets of CD8+ T cells. (G,H) Representative two-dimensional plots of NKG2D and PD-1 expression (G), and stacked bar graph showing the percentages of CD8+ T cell subsets defined by PD-1 and NKG2D expression (H). In (A,C,E,F), marker shapes indicate treatment groups as follows: filled circles, rat IgG2b isotype control antibody; open circles, anti-CD4 antibody. In (A,C,E,F), individual values are shown with mean ± SEM; in (H), data are presented as mean ± SEM. * p < 0.05; ** p < 0.01; ns: not significant (Mann–Whitney U test).
Figure 4
Figure 4
Effects of CD25+ T cell depletion on tumor growth. (A) Schematic of the experimental design. Six-week-old female BALB/c mice were randomly assigned to the treatment groups. After a 1-week acclimatization period, CT26-mock or CT26-ULBP2 (1 × 10⁶) were subcutaneously transplanted into the right flank. Mice were treated with anti-CD25 antibody or isotype control antibody (n = 6 per group). Antibodies were administered i.p. at 100 μg/mouse on days 7 and 14 post-transplantation. Created with BioRender.com. (B,C) Tumor growth curves (B) and tumor weights on day 21 post-transplantation (C). In (B,C), marker shapes indicate treatment groups as follows: filled circles, CT26-mock isotype control antibody; open circles, CT26-mock anti-CD25 antibody; filled squares, CT26-ULBP2 isotype control antibody; open squares, CT26-ULBP2 anti-CD25 antibody. In (B), data are presented as mean ± SEM; in (C), individual values are shown with mean ± SEM. ns: not significant (Mann–Whitney U test).
Figure 5
Figure 5
CD25+ T cell depletion reduces NKG2D expression on intratumoral CD8+ T cells in CT26-ULBP2 tumors. Tumors were harvested on day 21 post-transplantation from CT26-mock and CT26-ULBP2 tumor-bearing mice treated with anti-CD25 antibody or isotype control antibody, as described in Figure 4. Five tumors per group for CT26-mock and six per group for CT26-ULBP2 were analyzed. (A) Percentages of CD8+ T cells among CD45+ lymphocytes and of TEM and TCM subsets among CD8+ T cells. (B,C) Representative flow cytometry plots (B) and quantification (C) of the percentage of NKG2D+ cells among CD8+ T cells. (D,E) Representative plots (D) and quantification (E) of the percentages of PD-1neg, PD-1int, and PD-1high subsets among CD8+ T cells. (F) Percentages of NKG2D+ cells within PD-1neg, PD-1int, and PD-1high CD8+ T cell subsets. (G,H) Representative two-dimensional plots of PD-1 and NKG2D expression (G) and stacked bar graph showing the percentages of CD8+ T cell subsets defined by PD-1 and NKG2D expression (H). In (A,C,E,F), marker shapes indicate treatment groups as follows: filled circles, CT26-mock isotype control antibody; open circles, CT26-mock anti-CD25 antibody; filled squares, CT26-ULBP2 isotype control antibody; open squares, CT26-ULBP2 anti-CD25 antibody. In (A,C,E,F), individual values are shown with mean ± SEM; in (H), data are presented as mean ± SEM. * p < 0.05; ns: not significant (Mann–Whitney U test).
Figure 6
Figure 6
FlowSOM and Uniform Manifold Approximation and Projection (UMAP) analysis of TILs in CT26-mock and CT26-ULBP2 tumors. (A) UMAP heatmap of concatenated CD45+ lymphocytes (total of 1.6 million live cells from 32 tumor samples) showing marker expression patterns for CD8α, CD3, PD-1, NKG2D, and CD62L. Expression intensity is represented by color scale (red: high, blue: low). (B) FlowSOM clustering of 1.6 million lymphocytes identified 16 distinct clusters, labeled as C1–C16. (C) Cluster heatmap table generated using Cluster Explorer. Expression intensity is represented by color scale (red: high, blue: low). Clusters were grouped based on overall marker expression patterns. CD8+ T cell clusters were annotated as follows: C3, central-memory-like; C4, PD-1highNKG2Dhigh effector-memory-like; C8, PD-highNKG2Dlow effector-memory-like; C9, PD-1highNKG2DlowCD3dim effector-memory-like; C13, PD-1low effector-memory-like. (D) Stacked bar graphs showing the mean percentage ± SEM of each cluster per treatment group. (EG) UMAP density plots comparing each treatment group and its corresponding control: (E) anti-CD25 antibody treatment in CT26-mock tumors, (F) anti-CD25 antibody treatment in CT26-ULBP2 tumors, (G) anti-CD4 antibody treatment in CT26-ULBP2 tumors.
Figure 7
Figure 7
Treatment with anti-CTLA-4 antibody eliminates CT26-ULBP2 tumors. (A) Schematic of the experimental design. Six-week-old female BALB/c mice were randomly assigned to different treatment groups. After a 1-week acclimatization period, CT26-mock or CT26-ULBP2 cells (1 × 10⁶) were subcutaneously transplanted into the right flank. Mice were treated with anti-CTLA-4 antibody or isotype control antibody. In the CT26-mock model, a group treated with anti-CTLA-4 + anti-NKG2D antibodies was also included. Antibodies were administered i.p. at 200 μg per mouse on days 3 and 10 post-transplantation. Mice were monitored for tumor size and physical condition for 70 days. The primary endpoint was tumor volume comparison at day 21. CR rate and survival time were evaluated at the end of the observation period. Created with BioRender.com. (B,C) Tumor growth curves for CT26-mock (B) and CT26-ULBP2 (C). (D,E) Individual tumor growth curves for each treatment group in CT26-mock (D) and CT26-ULBP2 (E) tumor-bearing mice. Complete response (CR) rates are indicated in the figure. (F,G) Kaplan–Meier survival curves for CT26-mock (F) and CT26-ULBP2 (G) tumor-bearing mice. In (B), marker shapes indicate treatment groups as follows: filled circles, mouse IgG2b isotype control antibody; open circles, anti-CTLA-4 antibody; open squares, anti-CTLA-4 and anti-NKG2D antibodies. In (C), filled triangles, mouse IgG2b isotype control antibody; open triangles, anti-CTLA-4 antibody. In (B,C), tumor volumes were compared on day 21 post-transplantation. Data are presented as mean ± SEM, and statistical comparisons were performed using the Mann–Whitney U test. Survival curves in (F,G) were compared using the log-rank test. * p < 0.05; ** p < 0.01; *** p < 0.001.
Figure 8
Figure 8
Schematic representation of phenotypic changes in CD8+ T cell subsets following anti-CD25 antibody treatment in CT26 tumors. (A) In CT26-mock tumors, PD-1highNKG2Dhigh effector-memory-like CD8+ T cells (Cluster 4) are maintained. (B) In tumors ectopically expressing ULBP2, anti-CD25 antibody treatment is associated with a phenotypic shift toward PD-1highNKG2Dlow effector-memory-like CD8+ T cells (Cluster 8 or 9). Dashed inhibitory lines represent potential relief of CD4+CD25+ T-cell-mediated suppression. This figure summarizes observed phenotypic trends and illustrates a potential mechanism; however, the underlying pathways have not been experimentally validated. Created with BioRender.com.

Similar articles

References

    1. Robert C. A decade of immune-checkpoint inhibitors in cancer therapy. Nat. Commun. 2020;11:3801. doi: 10.1038/s41467-020-17670-y. - DOI - PMC - PubMed
    1. Darvin P., Toor S.M., Sasidharan Nair V., Elkord E. Immune checkpoint inhibitors: Recent progress and potential biomarkers. Exp. Mol. Med. 2018;50:1–11. doi: 10.1038/s12276-018-0191-1. - DOI - PMC - PubMed
    1. Kovacs S.A., Fekete J.T., Gyorffy B. Predictive biomarkers of immunotherapy response with pharmacological applications in solid tumors. Acta Pharmacol. Sin. 2023;44:1879–1889. doi: 10.1038/s41401-023-01079-6. - DOI - PMC - PubMed
    1. Sakaguchi S., Yamaguchi T., Nomura T., Ono M. Regulatory T cells and immune tolerance. Cell. 2008;133:775–787. doi: 10.1016/j.cell.2008.05.009. - DOI - PubMed
    1. Nishikawa H., Sakaguchi S. Regulatory T cells in tumor immunity. Int. J. Cancer J. Int. Du. Cancer. 2010;127:759–767. doi: 10.1002/ijc.25429. - DOI - PubMed

MeSH terms

Substances

LinkOut - more resources