. 2025 Jun 15;14(12):905.
doi: 10.3390/cells14120905.

Epigenetic Reprogramming of Cell Identity in the Rat Primary Neuron-Glia Cultures Involves Histone Serotonylation

Affiliations

Epigenetic Reprogramming of Cell Identity in the Rat Primary Neuron-Glia Cultures Involves Histone Serotonylation

Anastasia A Borodinova et al. Cells. .

Abstract

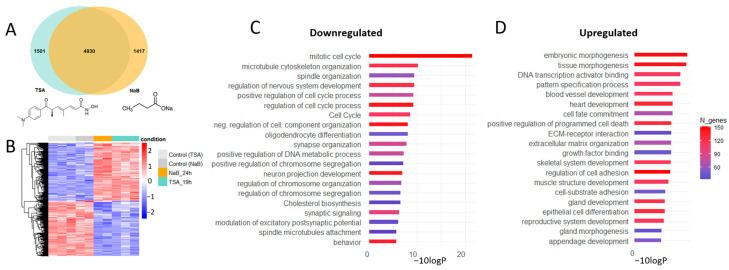
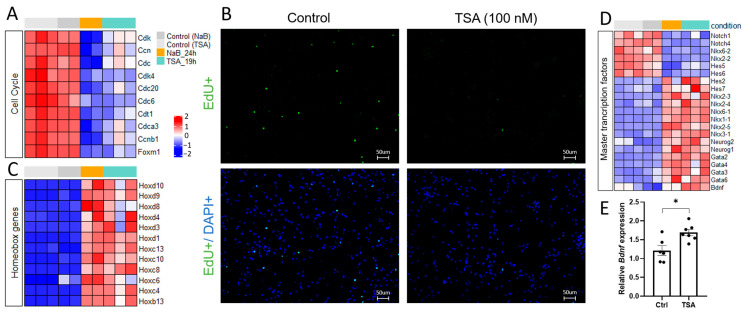
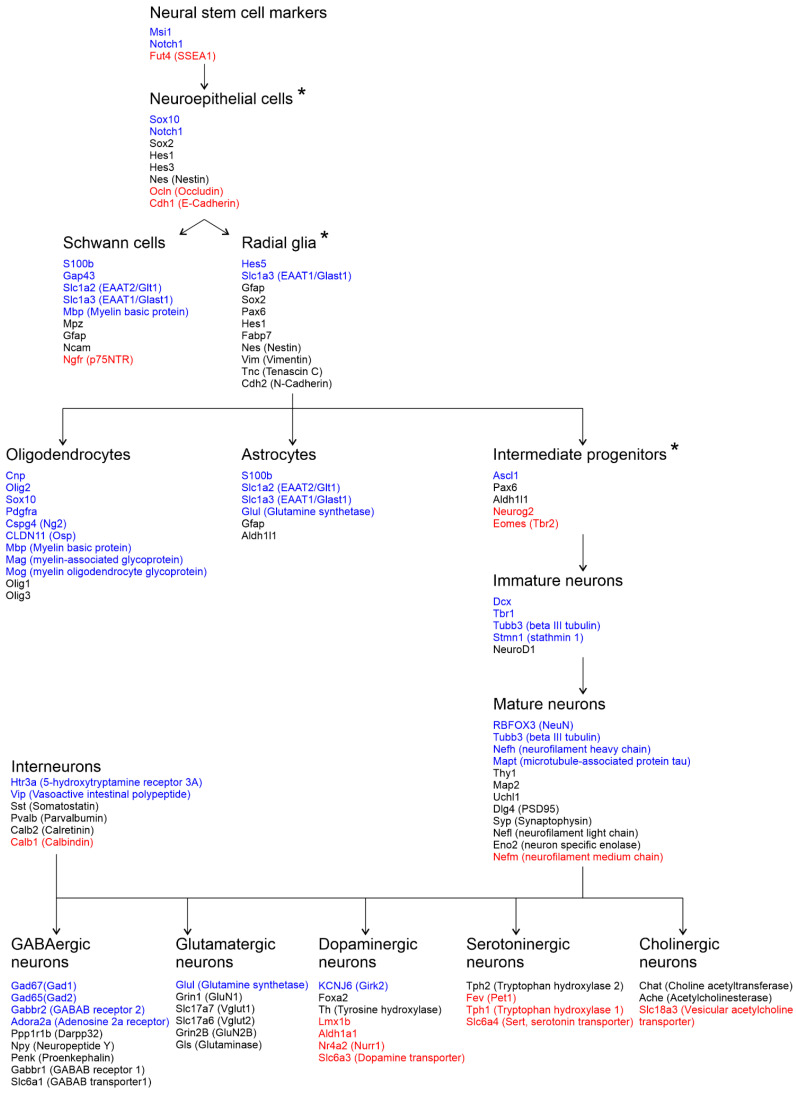
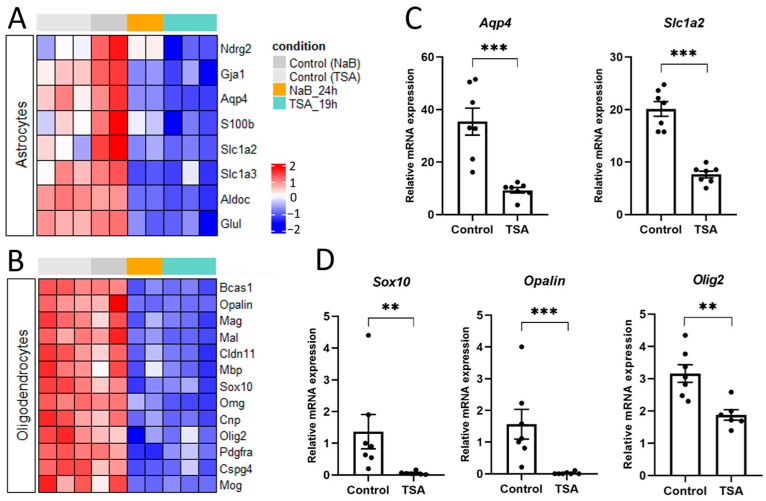
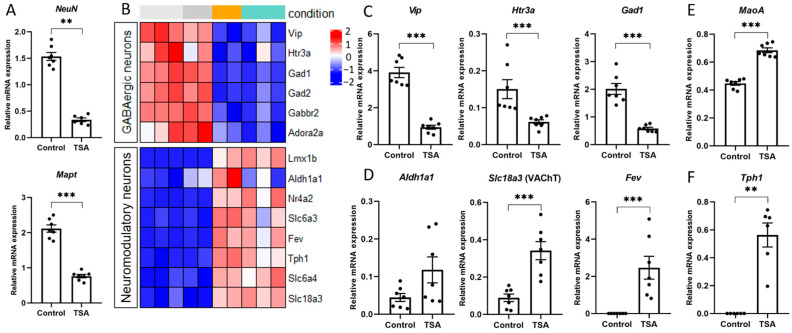
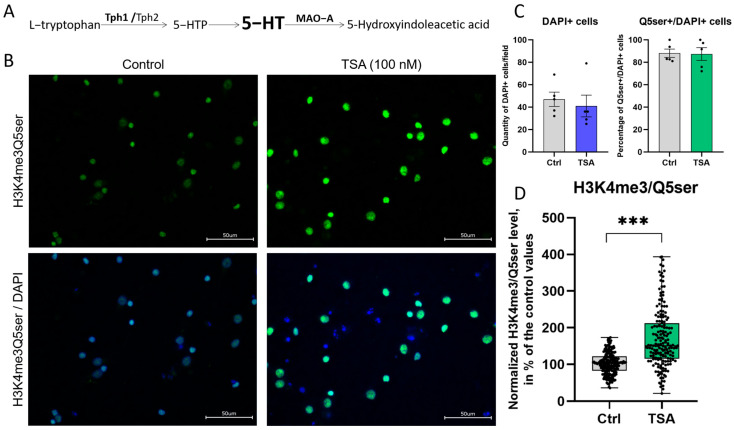
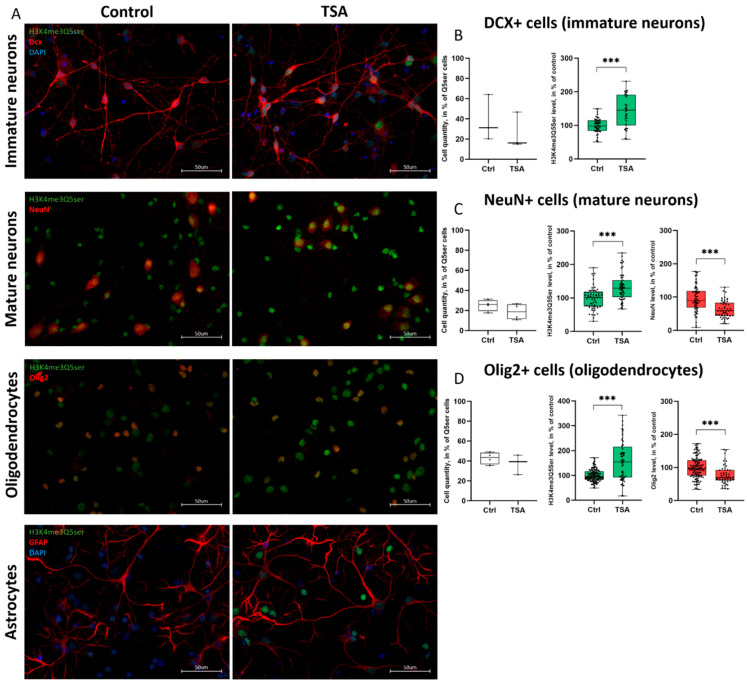
Epigenetic rearrangements can create a favorable environment for the intrinsic plasticity of brain cells, leading to cellular reprogramming into virtually any cell type through the induction of cell-specific transcriptional programs. In this study, we assessed how chromatin remodeling induced by broad-spectrum HDAC inhibitors affects cellular differentiation trajectories in rat primary neuron-glia cultures using a combination of transcriptomics, qPCR, and cytochemistry. We described the epigenetic regulation of transcriptional programs controlled by master transcription factors and neurotrophins in the context of neuronal and glial differentiation and evaluated the expression of representative cell-specific markers. The results obtained suggest that HDAC inhibitors reduce the proliferative potential of cultured cells and induce transcriptomic changes associated with cell differentiation and specialization. Particularly, we revealed a significant upregulation of genes typically expressed in neuromodulatory neurons and the downregulation of genes expressed in glia and inhibitory neurons. Transcriptional changes were accompanied by continuous elevation of histone serotonylation levels in both neurons and glia. Emerging shortly after HDAC inhibition, a complex chromatin remodeling, which includes histone serotonylation, persists over many hours in distinct brain cells. We assume that this sustained epigenetic mechanism likely helps to maintain transcriptional changes associated with cell fate commitment, possibly priming cells for long-term fate conversion.

Keywords: HDAC; cell identity; epigenetics; glia; histone serotonylation; neuron; reprogramming; transcriptional program.


Conflict of interest statement

The authors declare no conflicts of interest.

Figures

Figure 1
Figure 1
HDAC inhibitors TSA and NaB induce transcriptional changes in primary neuron cultures. (A)—Venn diagram illustrating the number of unique and overlapping differentially expressed genes (DEGs) in TSA-treated and NaB-treated neuron cultures. (B)—Cluster analysis of overlapping DEGs. Heatmap of 4930 overlapping DEGs showing differential expression in NaB-treated (orange) and TSA-treated neuron cultures (turquoise) compared to time-matched control cultures (gray). Values are shown as z-scored log-transformed normalized expression counts. The color scale indicates the expression levels (blue, low expression; red, high expression), measured in standard deviations from the row (genewise) mean. (C,D)—Gene Ontology (GO) analysis of the main enriched genes after HDAC inhibitors treatment. Bar charts show the top 20 most enriched GO terms for downregulated (C) and upregulated DEGs (D) based on Metascape. Gene ontologies are ranked by their significance.
Figure 2
Figure 2
HDAC inhibitors impair cell proliferation and stimulate cell differentiation in rat primary neuron cultures. (A)—Heatmap illustrating representative downregulated genes associated with the cell cycle in NaB-treated (orange) and TSA-treated neuron cultures (turquoise) compared to time-matched control cultures (gray). Values are shown as z-scored log-transformed normalized expression counts. The color scale indicates the expression levels (blue, low expression; red, high expression), measured in standard deviations from the row (genewise) mean. (B)—Representative micrographs of EdU-positive proliferating cells (green) in control and TSA-treated primary neuron cultures, revealed by click-chemistry. Cell nuclei are labeled with DAPI (blue). The scale bar was 50 µM. Magnification was 20×. (C,D)—Heatmaps illustrating representative upregulated homeobox genes (C) and master transcription factors (D) that control embryonic morphogenesis and brain cell differentiation. The color scale indicates the expression levels (blue, low expression; red, high expression). (E)—Quantification of the relative mRNA expression of differentiation factor BDNF using qPCR. * p < 0.05.
Figure 3
Figure 3
Scheme showing specific markers of diverse brain cells at different stages of their differentiation and specialization. Genes whose expression increases (red) or decreases (blue) after treatment of rat primary neuron cultures with histone deacetylase inhibitors are marked on the diagram. * labels the proliferating cells.
Figure 4
Figure 4
HDAC inhibitors alter mRNA expression of specific glial cell markers. (A,B)—Heatmaps illustrating representative downregulated genes encoding specific astrocyte markers (A) and oligodendrocyte markers related to the myelin synthesis process (B) in NaB-treated (orange) and TSA-treated neuron cultures (turquoise) compared to time-matched control cultures (gray). Values are shown as z-scored log-transformed normalized expression counts. The color scale indicates the expression levels (blue, low expression; red, high expression), measured in standard deviations from the row (genewise) mean. (C,D)—qPCR verification of RNAseq data using specific primer pairs for astrocyte (C) and oligodendrocyte markers (D). ** p < 0.01, *** p < 0.001.
Figure 5
Figure 5
HDAC inhibitors influence mRNA expression of neuronal markers. (A)—qPCR verification of RNAseq data using specific primer pairs for neuronal markers. (B)—Heatmap illustrating representative downregulated and upregulated genes specific for GABAergic interneurons (top panel) and neuromodulatory neurons (bottom panel) in NaB-treated (orange) and TSA-treated neuron cultures (turquoise) compared to time-matched control cultures (gray). Values are shown as z-scored log-transformed normalized expression counts. The color scale indicates the expression levels (blue, low expression; red, high expression), measured in standard deviations from the row (genewise) mean. (C)—qPCR verification of RNAseq data using specific primer pairs for Htr3a, Vip, and Gad1 genes specific for GABAergic interneurons. (D)—qPCR verification of RNAseq data using specific primer pairs for genes, specific for distinct neuromodulatory neurons, including Aldh1a1 (dopaminergic), Slc18a3 (cholinergic), and Fev (serotonergic). (E,F)—qPCR analysis of the expression of Tph1 and MaoA genes encoding crucial enzymes for serotonin metabolism. ** p < 0.01, *** p < 0.001.
Figure 6
Figure 6
HDAC inhibitor trichostatin A (TSA) enhances histone serotonylation in rat primary cortical cultures. (A)—Scheme of serotonin (5-HT) synthesis and metabolism with indication of key enzymes. (B)—Fluorescent microscopy of cell cultures stained with antibodies against H3K4me3Q5ser that targets histone H3 trimethylated on lysine 4 and serotonylated on glutamine 5 (green) and DAPI (blue). The scale bar was 50 µM. Magnification was 60×. (C)—Quantification of DAPI+ cells per field and percentage of H3K4me3Q5ser+ cells relative to the total number of DAPI+ cells in control and TSA-treated cultures. Results are presented as mean ± s.e.m. (D)—The box plot shows the results of densitometric analysis of histone serotonylation levels in control and TSA-treated cultures. Data were normalized and calculated as a % of control values in each biological replicate; each point shows the value for the individual cell, n = 5. Results are presented as median ± SD. *** p < 0.001.
Figure 7
Figure 7
Various populations of brain cells were affected by the HDAC inhibitor trichostatin A (TSA). (A)—Fluorescent microscopy shows co-localization of H3K4me3Q5ser marks (green) with one of the cell-specific markers (red) and DAPI (blue). The scale bar was 50 µM. Magnification was 60×. (BD)—Figures show the ratio of double-labeled cells relative to the total number of H3K4me3Q5ser+ cells (left panel), densitometric analysis of histone serotonylation levels (middle panel), and the levels of cell-specific transcription factors in control and TSA-treated cultures. Data were normalized and calculated as a % of control values; each point shows the value for the individual cell. Results are presented as median ± SD. *** p < 0.001.

Similar articles

References

    1. Juliandi B., Abematsu M., Nakashima K. Chromatin Remodeling in Neural Stem Cell Differentiation. Curr. Opin. Neurobiol. 2010;20:408–415. doi: 10.1016/j.conb.2010.04.001. - DOI - PubMed
    1. Hsieh J., Nakashima K., Kuwabara T., Mejia E., Gage F.H. Histone Deacetylase Inhibition-Mediated Neuronal Differentiation of Multipotent Adult Neural Progenitor Cells. Proc. Natl. Acad. Sci. USA. 2004;101:16659–16664. doi: 10.1073/pnas.0407643101. - DOI - PMC - PubMed
    1. Huang Y., Myers S.J., Dingledine R. Transcriptional Repression by REST: Recruitment of Sin3A and Histone Deacetylase to Neuronal Genes. Nat. Neurosci. 1999;2:867–872. doi: 10.1038/13165. - DOI - PubMed
    1. Humphrey G.W., Wang Y.H., Hirai T., Padmanabhan R., Panchision D.M., Newell L.F., McKay R.D., Howard B.H. Complementary Roles for Histone Deacetylases, 1, 2, and 3 in Differentiation of Pluripotent Stem Cells. Differentiation. 2008;76:348–356. doi: 10.1111/j.1432-0436.2007.00232.x. - DOI - PMC - PubMed
    1. Ye F., Chen Y., Hoang T., Montgomery R.L., Zhao X.H., Bu H., Hu T., Taketo M.M., van Es J.H., Clevers H., et al. HDAC1 and HDAC2 Regulate Oligodendrocyte Differentiation by Disrupting the β-Catenin–TCF Interaction. Nat. Neurosci. 2009;12:829–838. doi: 10.1038/nn.2333. - DOI - PMC - PubMed

LinkOut - more resources