

Side-by-Side Comparison of Culture Media Uncovers Phenotypic and Functional Differences in Primary Mouse Aortic Mural Cells
- PMID: 40558554
- PMCID: PMC12190375
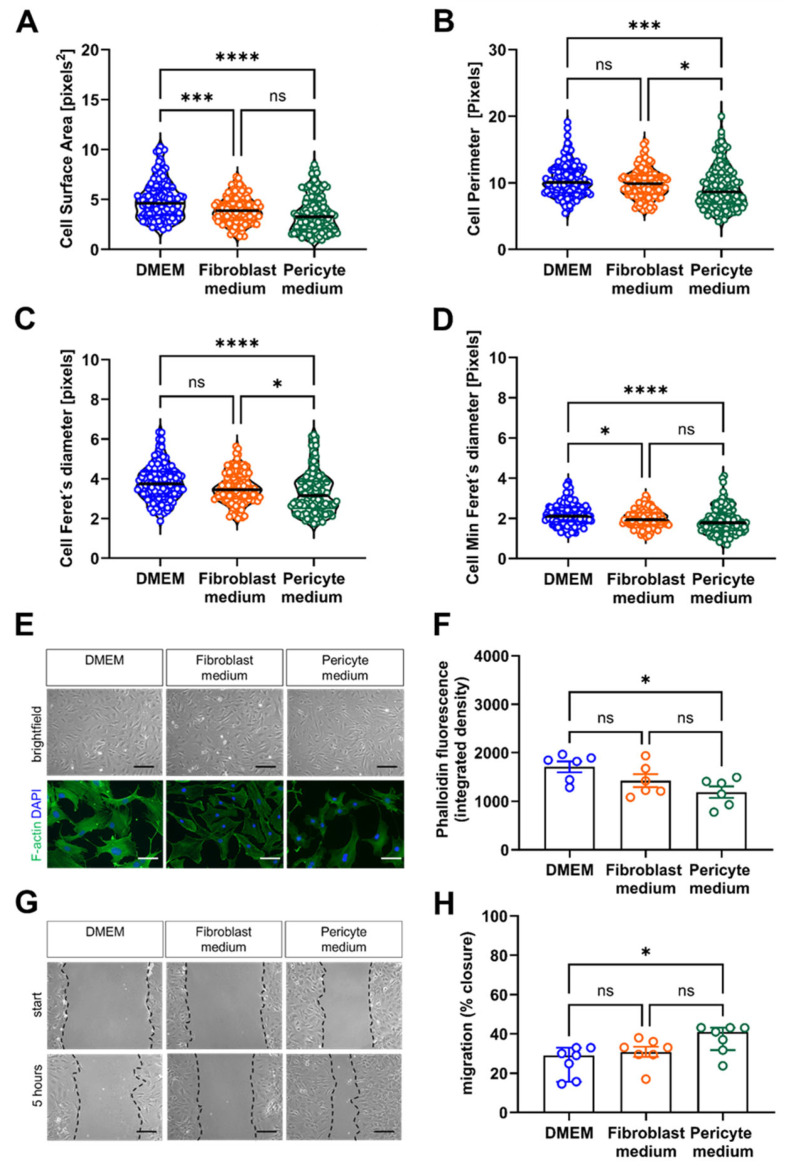
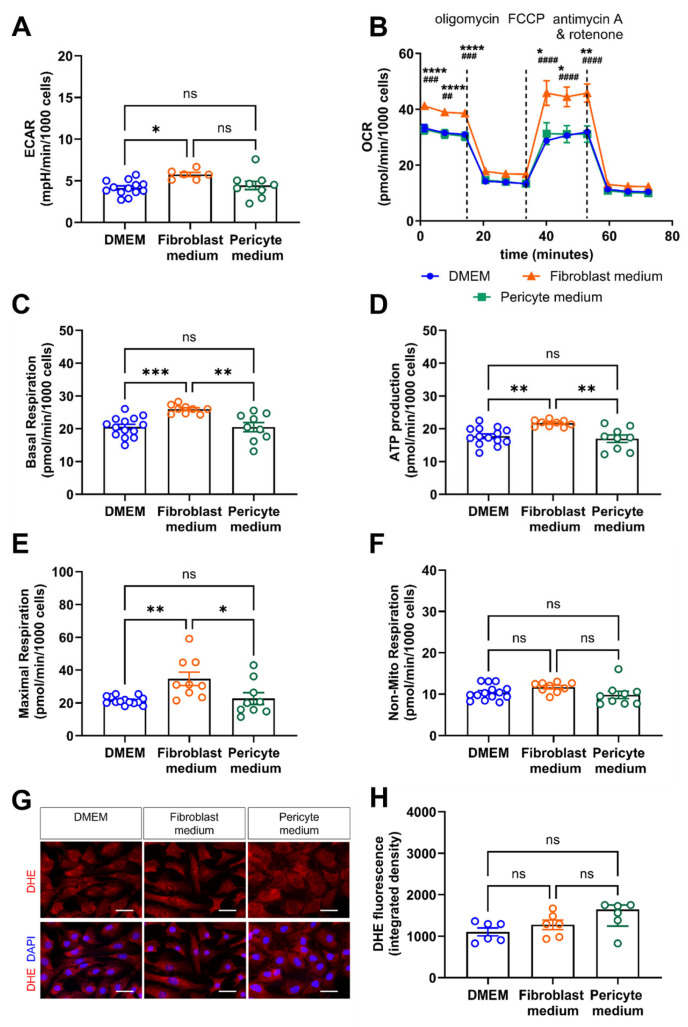
- DOI: 10.3390/cells14120927
Side-by-Side Comparison of Culture Media Uncovers Phenotypic and Functional Differences in Primary Mouse Aortic Mural Cells
Abstract
(1) Background: Vascular mural cells reside in the media and outer layers of the vessel wall. Their ability to proliferate and migrate or to change phenotype in response to external cues is a central feature of the vascular response to injury. Genetically engineered mice are used for loss- or gain-of-function analyses or lineage tracing in vivo, their primary cells for mechanistic studies in vitro. Whether and how cultivation conditions affect their phenotype and function is often overlooked. (2) Methods: Here, we systematically studied how the cultivation of primary mural cells isolated from the aorta of adult wild-type mice in either basal medium (DMEM) or special media formulated for the cultivation of fibroblasts or pericytes affects their phenotype and function. (3) Results: Medium composition did not alter cell viability, but the mRNA levels of differentiated smooth muscle cell markers were highest in vascular mural cells expanded in DMEM. Conversely, significantly higher numbers of proliferating and migrating cells were observed in cells expanded in Pericyte medium, and cytoskeletal rearrangements supported increased migratory capacities. Significantly reduced telomere lengths and metabolic reprogramming was observed in aortic mural cells cultured in Fibroblast medium. (4) Conclusions: Our findings underline the plasticity of primary aortic mural cells and highlight the importance of the culture media composition during their expansion, which could be exploited to interrogate their responsiveness to external stimuli or conditions observed in vivo or in patients.
Keywords: fibroblasts; metabolism; migration; pericytes; phenotypic plasticity; proliferation; smooth muscle cells; vascular remodeling.
Conflict of interest statement
The authors declare no conflicts of interest.
Figures


References
-
- Majesky M.W., Horita H., Ostriker A., Lu S., Regan J.N., Bagchi A., Dong X.R., Poczobutt J., Nemenoff R.A., Weiser-Evans M.C. Differentiated Smooth Muscle Cells Generate a Subpopulation of Resident Vascular Progenitor Cells in the Adventitia Regulated by Klf4. Circ. Res. 2017;120:296–311. doi: 10.1161/CIRCRESAHA.116.309322. - DOI - PMC - PubMed
Publication types
MeSH terms
Substances
Grants and funding
LinkOut - more resources
Full Text Sources
