

Silver-Titania Nanocomposites for Photothermal Applications
- PMID: 40558760
- PMCID: PMC12192153
- DOI: 10.3390/gels11060461
Silver-Titania Nanocomposites for Photothermal Applications
Abstract
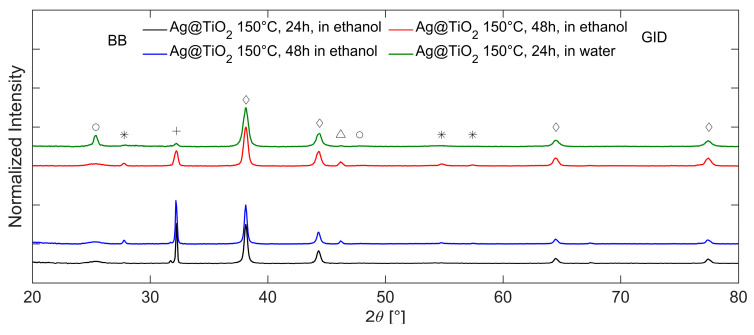
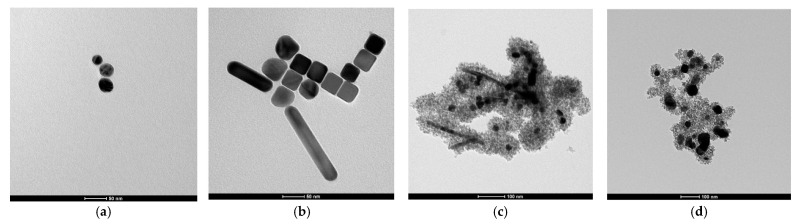
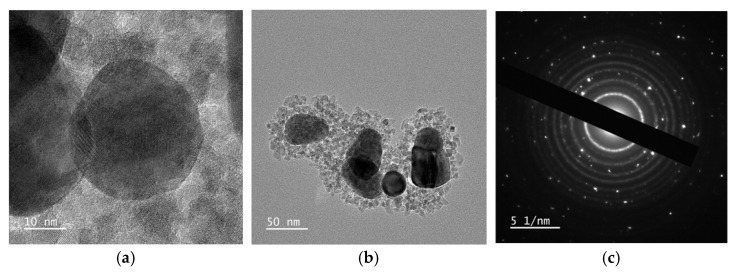
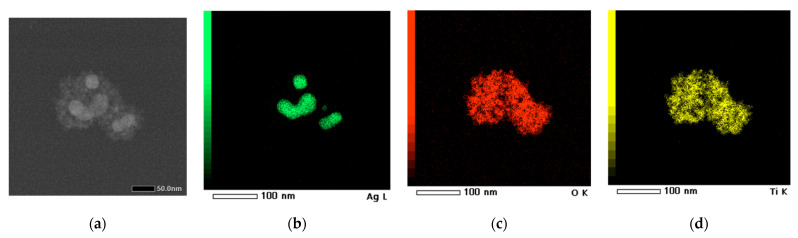
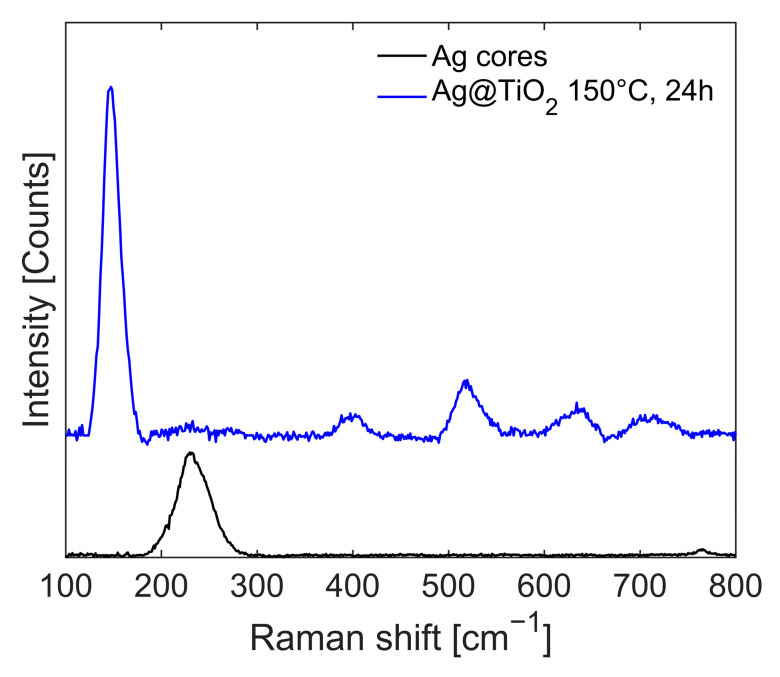
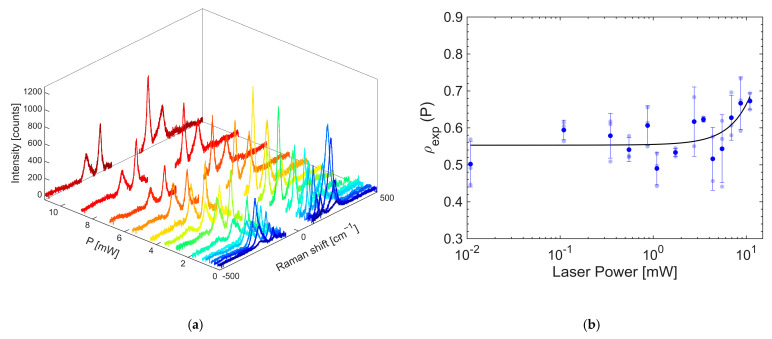
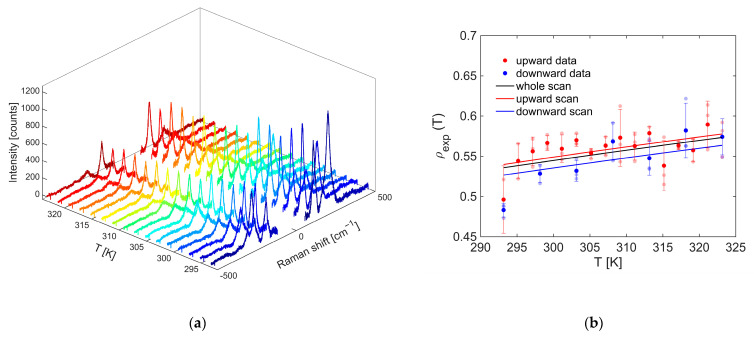
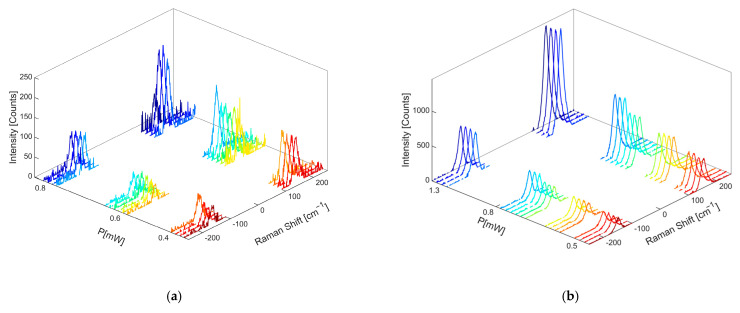
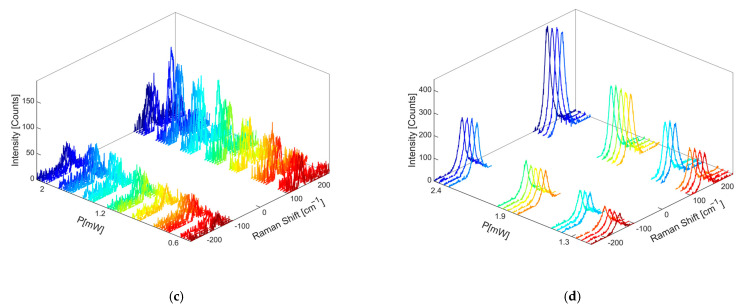
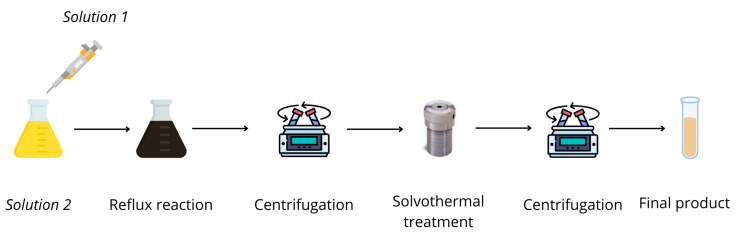
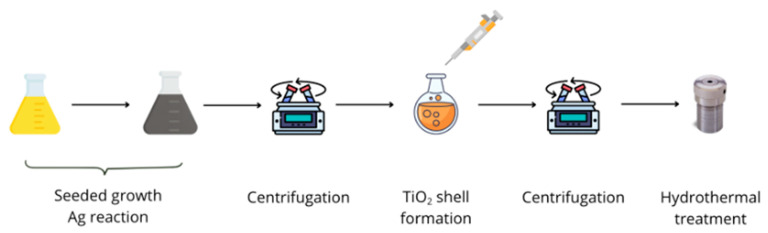
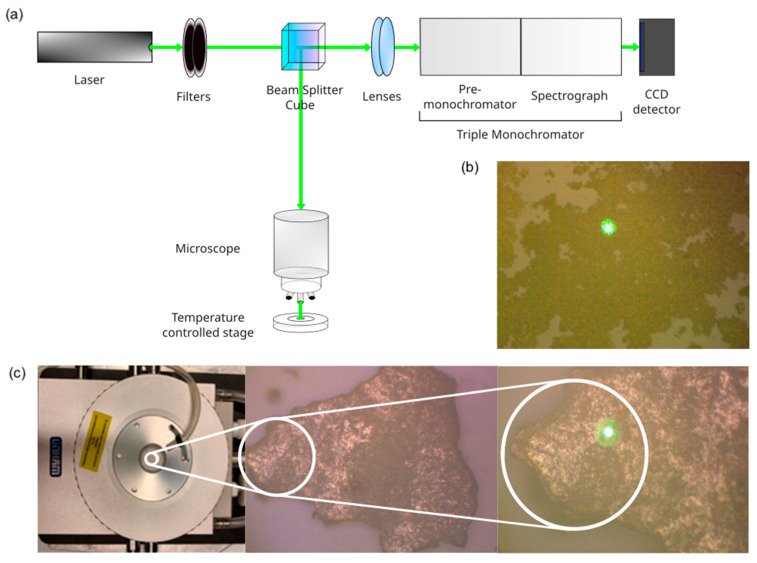
Local temperature measurement is crucial for understanding nanoscale thermal transport and developing nanodevices for biomedical, photonic, and optoelectronic applications. The rise of photothermal therapy for cancer treatment has increased the demand for high-resolution nanothermometric techniques capable of non-contact intracellular temperature measurement and modification. Raman spectroscopy meets this need: the ratio of anti-Stokes to Stokes Raman intensities for a specific vibrational mode correlates with local temperature through the Boltzmann distribution. The present study proposes a novel photothermal therapy agent designed to advance the current state of the art while adhering to green chemistry principles, thereby favoring low-temperature synthesis involving limited energy consumption. A key challenge in this field is to achieve close contact between plasmonic nanosystems, which act as nanoheaters, and local temperature sensors. This is achieved by employing silver nanoparticles as a heat release agent, coated with anatase-phase titanium dioxide, as a local temperature sensor. The proposed synthesis, which combines refluxing and subcritical solvothermal treatments, enables direct anatase formation, despite its metastability under standard conditions, thus eliminating the need for a calcination step. Structural characterization through SAED-HRTEM and Raman spectroscopy confirms the successful crystallization of the desired phase. Moreover, the nanothermometry measurements conducted at various wavelengths ultimately demonstrate both the effectiveness of these nanomaterials as thermometric probes, with a relative sensitivity of about 0.24 K-1%, and their capability as local heaters, with a release of a few tens of degrees. This work demonstrates a new synthetic strategy for these nanocomposites, which offers a promising pathway for the optimization of nanosystems in therapeutic applications.
Keywords: Raman thermometry; green chemistry; nanocomposites; photothermal therapy; sol-gel synthesis; solvothermal treatment.
Conflict of interest statement
The authors declare no conflicts of interest.
Figures
Similar articles
-
Systemic pharmacological treatments for chronic plaque psoriasis: a network meta-analysis.Cochrane Database Syst Rev. 2021 Apr 19;4(4):CD011535. doi: 10.1002/14651858.CD011535.pub4. Cochrane Database Syst Rev. 2021. Update in: Cochrane Database Syst Rev. 2022 May 23;5:CD011535. doi: 10.1002/14651858.CD011535.pub5. PMID: 33871055 Free PMC article. Updated.
-
Signs and symptoms to determine if a patient presenting in primary care or hospital outpatient settings has COVID-19.Cochrane Database Syst Rev. 2022 May 20;5(5):CD013665. doi: 10.1002/14651858.CD013665.pub3. Cochrane Database Syst Rev. 2022. PMID: 35593186 Free PMC article.
-
Systemic pharmacological treatments for chronic plaque psoriasis: a network meta-analysis.Cochrane Database Syst Rev. 2017 Dec 22;12(12):CD011535. doi: 10.1002/14651858.CD011535.pub2. Cochrane Database Syst Rev. 2017. Update in: Cochrane Database Syst Rev. 2020 Jan 9;1:CD011535. doi: 10.1002/14651858.CD011535.pub3. PMID: 29271481 Free PMC article. Updated.
-
A rapid and systematic review of the clinical effectiveness and cost-effectiveness of topotecan for ovarian cancer.Health Technol Assess. 2001;5(28):1-110. doi: 10.3310/hta5280. Health Technol Assess. 2001. PMID: 11701100
-
Home treatment for mental health problems: a systematic review.Health Technol Assess. 2001;5(15):1-139. doi: 10.3310/hta5150. Health Technol Assess. 2001. PMID: 11532236
References
-
- Gao P., Wang H., Cheng Y. Strategies for efficient photothermal therapy at mild temperatures: Progresses and challenges. Chin. Chem. Lett. 2022;33:575–586. doi: 10.1016/j.cclet.2021.08.023. - DOI
-
- Fratila R.M., De La Fuente J.M. Nanomaterials for Magnetic and Optical Hyperthermia Applications. 1st ed. Elsevier; Amsterdam, The Netherlands: 2018.
Grants and funding
LinkOut - more resources
Full Text Sources
