. 2025 May 24;9(2):15.
doi: 10.3390/epigenomes9020015.

Histone H3 Lysine 9 Acetylation Plays a Role in Adipogenesis of Periodontal Ligament-Derived Stem Cells

Affiliations

Histone H3 Lysine 9 Acetylation Plays a Role in Adipogenesis of Periodontal Ligament-Derived Stem Cells

Julio A Montero-Del-Toro et al. Epigenomes. .

Abstract

Background: The epigenetic regulation of adipogenic differentiation in dental stem cells (DSCs) remains poorly understood, as research has prioritized osteogenic differentiation for dental applications. However, elucidating these mechanisms could enable novel regenerative strategies for soft tissue engineering. Periodontal ligament stem cells (PDLSCs) exhibit notable adipogenic potential, possibly linked to histone 3 acetylation at lysine 9 (H3K9ac); however, the mechanistic role of this modification remains unclear.

Methods: To address this gap, we investigated how histone deacetylase inhibitors (HDACis)-valproic acid (VPA, 8 mM) and trichostatin A (TSA, 100 nM)-modulate H3K9ac dynamics, adipogenic gene expression (C/EBPβ and PPARγ-2), and chromatin remodeling during PDLSCs differentiation. Techniques used included quantitative PCR (qPCR), lipid droplet analysis, and chromatin immunoprecipitation followed by qPCR (ChIP-qPCR).

Results: TSA-treated cells exhibited increased lipid deposition with smaller lipid droplets compared to VPA-treated cells. Global H3K9ac levels correlated positively with adipogenic progression. VPA induced early upregulation of C/EBPβ and PPARγ-2 (day 7), whereas TSA triggered a delayed but stronger PPARγ-2 expression. ChIP-qPCR analysis revealed significant H3K9ac enrichment at the PPARγ-2 promoter in TSA-treated cells, indicating enhanced chromatin accessibility.

Conclusions: These findings demonstrate that H3K9ac-mediated epigenetic remodeling plays a critical role in the adipogenic differentiation of PDLSCs and identifies TSA as a potential tool for modulating this process.

Keywords: adipogenic differentiation; dental stem cells; histone H3 lysine 9 acetylation; histone deacetylase inhibitors; periodontal ligament stem cells.


Conflict of interest statement

The authors declare no conflicts of interest.

Figures

Figure 1
Figure 1
Characterization of mesenchymal properties in periodontal ligament-derived cells. (A) Multilineage differentiation potential was assessed on day 14 for chondrogenic and osteogenic lineages, and on day 21 for the adipogenic lineage. (B) Expression of mesenchymal surface markers (CD73, CD90, CD105) was analyzed by RT-qPCR. (C) Expression profiles of stemness-related markers (Nanog, Sox2, Oct4, KLF4, and c-MYC) were evaluated by RT-qPCR. All mRNA expression data are presented as mean ± SD (n = 3) and normalized to β-actin as the housekeeping gene. Statistical significance was determined by one-way ANOVA followed by Tukey’s post hoc test, comparing data sets from the same time point. Significance levels are indicated as * (p < 0.05), ** (p < 0.01), and **** (p < 0.0001). The black and blue scale bars indicate 133 μm and 75 μm, respectively.
Figure 3
Figure 3
Dynamics of H3K9 acetylation mediated by VPA or TSA in periodontal ligament stem cells. (A) Western blot analysis of H3K9ac (17 kDa) and total H3 (15 kDa) following a 72-h pretreatment with 8 mM VPA or 100 nM TSA, with cells subsequently maintained in α-MEM basal medium for 28 days. (B) Quantitative analysis of H3K9ac levels normalized to total H3 from panel A. (C) Western blot analysis of H3K9ac and total H3 in cells pretreated with VPA or TSA for 72 h and subsequently maintained in adipogenic induction medium (AIM) for 28 days. (D) Quantification of H3K9ac/H3 ratios from panel C. For all Western blot analyses, 10 μg of protein was loaded per lane. Data represent mean ± SD (n = 3). Statistical significance was determined by two-way ANOVA followed by Tukey’s post hoc test, comparing time points within each treatment group. Significance levels are indicated as follows: ns (not significant, p ≥ 0.05), * p < 0.05, ** p < 0.01, *** p < 0.001, and **** p < 0.0001.
Figure 2
Figure 2
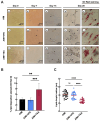
Effect of histone deacetylase inhibitors on adipogenic induction in periodontal ligament stem cells. (A) Morphological changes during 28-day adipogenic induction. Panels (ae) show cultures treated with adipogenic induction medium only (AIM), (fj) AIM supplemented with valproic acid (AIM + VPA), and (ko) AIM supplemented with TSA (AIM + TSA). All groups were maintained in AIM and basal α-MEM medium (α-MEM). Panels (e,j,o) display Oil Red O staining of lipid droplets on day 28 of adipogenic induction. Photomicrographs (20×) depict progressive differentiation, with arrows (►) highlighting key morphological changes. (B) Quantification of lipid accumulation on day 28, expressed as the percentage of Oil Red O-positive area (red pixels/total pixels) in representative fields (n = 30; image resolution: 4080 × 3072 pixels). (C) Average radius of lipid droplets measured after 28 days of adipogenic induction (n = 30). Statistical significance was determined by one-way ANOVA followed by Tukey’s post hoc test, comparing data sets from the same time point. Significance levels are indicated as ** (p < 0.01), *** (p < 0.001), and **** (p < 0.0001). ns: not significant.
Figure 4
Figure 4
Analysis of PPARγ-2 and C/EBPβ expression during adipogenic differentiation of periodontal ligament stem cells: Periodontal ligament stem cells were pretreated with 8 mM VPA or 100 nM TSA for 72 h, followed by a 28-day adipogenic induction using adipogenic induction medium (AIM). Cells were harvested at specified time points (days 0, 7, 14, and 28) for gene expression analysis. (A) PPARγ-2 and (B) C/EBPβ mRNA levels were quantified by RT-qPCR, with expression normalized to the 18S rRNA housekeeping gene. Data represent the mean ± SD of three independent experiments (n = 3). Statistical significance was determined by one-way ANOVA with Dunnett’s post hoc test, comparing each time point to day 0 controls. Significance levels are indicated as: * p < 0.05, ** p < 0.01, *** p < 0.001, and **** p < 0.0001.
Figure 5
Figure 5
H3K9ac enrichment profile at the PPARγ-2 promoter region during adipogenesis in periodontal ligament stem cells. (A) Genomic map showing predicted binding sites within the PPARγ-2 promoter region. (B) H3K9ac enrichment at PPARγ-2 promoter binding sites following treatment with VPA or TSA on day 0 of adipogenic induction. (C) H3K9ac enrichment at putative PPARγ-2 promoter (Prom-PPARγ2) binding sites after VPA or TSA treatment on day 14 of adipogenic induction. Data represent mean ± SD (n = 3 biological replicates). Asterisks indicate statistically significant differences between evaluated regions within the same treatment group, determined by two-way ANOVA followed by Tukey’s post hoc test: ns (not significant, p ≥ 0.05), * p < 0.05, ** p < 0.01, *** p < 0.001, **** p < 0.0001.
Figure 6
Figure 6
Proposed mechanism of H3K9 acetylation-mediated regulation of adipogenesis in periodontal ligament stem cells: The lipophilic histone deacetylase inhibitors VPA (144 Da) and TSA (302.37 Da) passively diffuse across the plasma membrane and accumulate in the nucleus, where they inhibit class I/II histone deacetylases. This inhibition increases acetylation of histone H3 at lysine 9 (H3K9ac), promoting chromatin relaxation at the PPARγ-2 promoter region (NG_011749.1). The resulting open chromatin structure facilitates recruitment of the transcriptional machinery, enhancing PPARγ-2 expression (orange peaks). Our results reveal distinct temporal acetylation patterns between the two treatments. VPA-treated cells exhibit an immediate peak in H3K9 acetylation ( blue peaks) following treatment (day 0 of adipogenesis), leading to early activation of PPARγ-2 transcription, and accelerated morphological changes. This early effect is reflected by pronounced lipid droplet accumulation during the initial stages of differentiation. In contrast, TSA-treated cells display a more sustained acetylation profile (red peaks), with a progressive accumulation of H3K9ac marks (green peaks) at the PPARγ-2 promoter throughout the differentiation process. This epigenetic pattern corresponds to prolonged gene expression and more gradual morphological changes but ultimately results in higher preadipocyte density and more abundant lipid accumulation at later stages, as confirmed by specific in vitro culture staining. The black line represents the PPARγ-2 region of the sequence used for primers design, with site 2 indicated by the brown line and site 4 by the green line.

Similar articles

References

    1. Ullah I., Subbarao R.B., Rho G.J. Human Mesenchymal Stem Cells—Current Trends and Future Prospective. Biosci. Rep. 2015;35:e00191. doi: 10.1042/BSR20150025. - DOI - PMC - PubMed
    1. Uccelli A., Moretta L., Pistoia V. Mesenchymal Stem Cells in Health and Disease. Nat. Rev. Immunol. 2008;8:726–736. doi: 10.1038/nri2395. - DOI - PubMed
    1. Ambele M.A., Dhanraj P., Giles R., Pepper M.S. Adipogenesis: A Complex Interplay of Multiple Molecular Determinants and Pathways. Int. J. Mol. Sci. 2020;21:4283. doi: 10.3390/ijms21124283. - DOI - PMC - PubMed
    1. Macchia P.E., Nettore I.C., Franchini F., Santana-Viera L., Ungaro P. Epigenetic Regulation of Adipogenesis by Histone-Modifying Enzymes. Epigenomics. 2021;13:235–251. doi: 10.2217/epi-2020-0304. - DOI - PubMed
    1. Darwish N.M., Gouda W., Almutairi S.M., Elshikh M.S., Morcos G.N.B. PPARG Expression Patterns and Correlations in Obesity. J. King Saud Univ. Sci. 2022;34:102116. doi: 10.1016/j.jksus.2022.102116. - DOI

LinkOut - more resources