. 2025 Jun 12;16(6):220.
doi: 10.3390/jfb16060220.

A Modular Biomimetic Preclinical Platform to Elucidate the Interaction Between Cancer Cells and the Bone Metastatic Niche

Affiliations

A Modular Biomimetic Preclinical Platform to Elucidate the Interaction Between Cancer Cells and the Bone Metastatic Niche

Claudia Cocchi et al. J Funct Biomater. .

Abstract

Breast cancer (BC) frequently metastasizes to bone, leading to poor patient prognosis. The infiltration of cancer cells in bone impairs its homeostasis, triggering a pathological interaction between tumors and resident cells. Preclinical models able to mimic the bone microenvironment are needed to advance translational findings on BC mechanisms and treatments. We designed strontium-doped calcium phosphate cement to be employed for culturing cancer and bone cells and developed an in vitro bone metastasis model. The platform was established step by step, starting with the monoculture of cancer cells, mature osteoblasts (OBs) differentiated from mesenchymal stem cells, and mature osteoclasts (OCs) differentiated from Peripheral Blood Mononuclear Cells. The model was implemented with the co-culture of cancer cells with OBs or OCs, or the co-culture of OBs and OCs, allowing us to discriminate the interaction between the actors of the bone metastatic niche. The biomimetic material was further challenged with bone metastasis patient-derived material, showing good versatility and biocompatibility, suggesting its potential use as bone substitute. Overall, we developed a bone-mimicking model able to reproduce reciprocal interactions between cancer and bone cells in a biomimetic environment suitable for studying the biomolecular determinants of bone metastasis and, in the future, as a drug efficacy platform.

Keywords: bone metastasis; breast cancer; osteoblasts; osteoclasts; patient-derived explants; preclinical platform; tricalcium phosphate cements.


Conflict of interest statement

The authors declare no conflicts of interest.

Figures

Figure 1
Figure 1
Characterization of SrCPCs. (A) XRD analysis of bone cements, inorganic precursor (bottom) and hardened cement (top). (B) ESEM micrographs of the surface of the samples (scale bar: 2 μm, inset scale bar: 200 nm). (C) Chemical composition of inorganic precursor and hardened cements with the respective setting times.
Figure 2
Figure 2
Breast cancer cell monoculture on SrCPCs. (A) Growth replicate curves of BC cell line MDA-MB-231 from day 1 to day 7 in 2D condition (top) and on SrCPCs (bottom). (B) Confocal microscopy images of MDA-MB-231 on SrCPCs at 20× magnification on day 3 (72 h) and day 7 of culture. The cells are stained with DAPI (blue—first column) and Phalloidin AlexaFluor488 (FITC, green—second column). In the third column, the merge of the staining is shown. All experiments were performed in biological duplicates, each with three technical replicates. The data are expressed as Mean ± SD. ** p < 0.01.
Figure 3
Figure 3
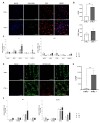
Differentiation of bone cells on SrCPCs. (A) Confocal microscopy images of PBMCs on day 14 of culture in differentiation to OCs at 20× magnification. The three columns refer to the DAPI staining of nuclei, the TRITC staining for F-actin (Phalloidin), and the FITC staining to detect TRAP, a marker of mature OC. The stainings are merged in the fourth column. (B) Evaluations of the corrective total cell fluorescence (graph above) and the cell area (graph below) by Image J software. Thirty cells per images, only on SrCPCs, were analyzed for a total of ninety cells. The data are mean ± SD. ** p < 0.01. (C) Gene expression analyses were carried out by real-time PCR at different time points. Left: in 2D condition; right: on 3D SrCPCs. The reference sample was the negative control of OCs’ differentiation collected on day 7 of culture. 2−∆∆Ct method was used for analysis. The data are mean ± SD. Statistical significance was performed with Student’s t test: * p < 0.05. ** p < 0.01. Biological replicates = 2; technical replicates = 3. (D) Confocal microscopy images of H-MSC on day 14 of culture in differentiation to OBs at 20× magnification. The three columns refer to the DAPI staining of nuclei, the FITC staining for F-actin, and the TRITC staining to detect Osteocalcin, a marker of mature OB. The stainings are merged in the fourth column. (E) Evaluation of corrective total cell fluorescence by Image J software. Thirty cells per image were analyzed for a total of ninety cells. The values were normalized with respect to CTRL−. The data are mean ± SD. ** p < 0.01. (F) Gene expression analyses were carried out by real-time PCR. The reference sample was the negative control of OBs’ differentiation, collected on day 7 of culture. The 2−∆∆Ct method was used for analysis. The data are mean ± SD. Statistical significance was performed with Student’s t test: * p < 0.05. ** p < 0.01. Biological replicates = 2; technical replicates = 3.
Figure 4
Figure 4
Co-cultures on SrCPCs. (A) Scheme of co-culture of OBs and cancer cells. Confocal microscopy images of h-MSC in differentiation to osteoblasts at 20× on day 26 of culture. The three columns refer to the DAPI staining of nuclei, the TRITC staining for F-actin (Phalloidin), and the FITC staining to detect Osteocalcin, a marker of mature osteoblast. The stainings are merged in the fourth column. MTT proliferation cancer cell graph of two biological replicates in co-culture or alone. Mean ± SD. (B) Scheme of co-culture of OCs and cancer cells. Confocal microscopy images of PBMCs in differentiation to OCs at 20× on day 14 of culture. The three columns refer to the DAPI staining of nuclei, the TRITC staining for F-actin (Phalloidin), and FITC staining to detect TRAP, a marker of mature OC. The stainings are merged in the fourth column. MTT proliferation cancer cell graph of two biological replicates in co-culture or alone. Mean ± SD. (C) Scheme of co-culture of OBs and OCs. Confocal microscopy images of h-MSC and PBMCs in differentiation to OBs and OC, respectively, at 20× on day 26 of culture. The three columns refer to the DAPI staining of nuclei, the TRITC staining for F-actin (Phalloidin), and the FITC staining to detect Osteocalcin and TRAP. The stainings are merged in the fourth column. Created in https://BioRender.com (accessed on 5 March 2025).
Figure 5
Figure 5
Ex vivo validation of SrCPCs’ effects on PDEs. (A) Viability assay using Presto Blue® reagent performed on days 1, 3, and 7 after seeding. (B) Evaluation of cellular necrosis through quantification of the LDH released in culture medium on days 1, 3, and 7 after seeding. (C) The gene expression analyses were performed on total cellular RNA extracted from half of PDEs sacrificed for each time point (days 3 and 7 after seeding). The 2−∆∆Ct method was used to analyze the relative expression of the target genes. The data were normalized on the expression of GAPDH housekeeping gene of PDEs only on day 3. Each experiment was composed of three PDEs per condition. One PDE per condition was sacrificed on day 3 or 7 after seeding and after viability/necrosis analyses and cut into two pieces used for RNA extraction or H&E stain (see Figure 6).
Figure 6
Figure 6
H&E staining showing good biocompatibility of SrCPCs on PDEs. (Upper panel): Representative pictures of the baseline tissue architecture and viability of Patient 1’s material before the culture set up (day 0). (Bottom left panel): Representative picture of PDEs only after 3 and 7 days of culture. (Bottom right panel): Representative picture of PDEs cultured on SrCPCs after 3 and 7 days of culture. All pictures were captured at the inner part of PDEs’ tissue samples.
Figure 7
Figure 7
Ex vivo validation of SrCPCs effects on BMET-3 patient-derived cells. (A) Viability assay using Presto Blue® reagent performed on days 1, 3, and 7 after the cells’ seeding on a 48-well plate or SrCPCs. (B) Representative images of a Live/Dead assay on day 7 after seeding cells on SrCPCs. Scale bar = 200 µm. (C) Viability assay using Presto Blue® reagent performed on days 1, 3, and 7 after the cells’ seeding on SrCPCs. (D) Evaluation of cellular necrosis through quantification of the LDH released in culture medium on days 1, 3, and 7 after seeding on SrCPCs. (E) Gene expression analyses performed on total cellular RNA extracted from BMET-3 cells grown on one SrCPC sacrificed for each time point (Days 3 and 7 after seeding). The 2−∆∆Ct method was used to analyze the relative expression of the target genes, and Student’s t-test was performed as appropriate without reaching statistical significance. The data were normalized on the expression of the GAPDH housekeeping gene on day 3. Each experiment was conducted in technical and biological triplicate, excluding non-measurable samples for gene expression analyses.

Similar articles

References

    1. Giaquinto A.N., Sung H., Newman L.A., Freedman R.A., Smith R.A., Star J., Jemal A., Siegel R.L. Breast cancer statistics 2024. CA Cancer J. Clin. 2024;74:477–495. doi: 10.3322/caac.21863. - DOI - PubMed
    1. Sui L., Wang J., Jiang W.G., Song X., Ye L. Molecular mechanism of bone metastasis in breast cancer. Front. Oncol. 2024;13:1401113. doi: 10.3389/fonc.2024.1401113. - DOI - PMC - PubMed
    1. Xiong X., Zheng L.W., Ding Y., Chen Y.F., Cai Y.W., Wang L.P., Huang L., Liu C.C., Shao Z.M., Yu K.D. Breast cancer: Pathogenesis and treatments. Signal Transduct. Target. Ther. 2025;10:49. doi: 10.1038/s41392-024-02108-4. - DOI - PMC - PubMed
    1. Coleman R.E., Croucher P.I., Padhani A.R., Clézardin P., Chow E., Fallon M., Guise T., Colangeli S., Capanna R., Costa L. Bone metastases. Nat. Rev. Dis. Prim. 2020;6:83. doi: 10.1038/s41572-020-00216-3. - DOI - PubMed
    1. Kang Y., Siegel P.M., Shu W., Drobnjak M., Kakonen S.M., Cordón-Cardo C., Guise T.A., Massagué J. A multigenic program mediating breast cancer metastasis to bone. Cancer Cell. 2003;3:537–549. doi: 10.1016/S1535-6108(03)00132-6. - DOI - PubMed

LinkOut - more resources