

Polychlorinated Biphenyl Exposure Alters tRNA Transcriptome in High-Fat Diet-Fed Mouse Liver
- PMID: 40559619
- PMCID: PMC12195632
- DOI: 10.3390/ncrna11030041
Polychlorinated Biphenyl Exposure Alters tRNA Transcriptome in High-Fat Diet-Fed Mouse Liver
Abstract
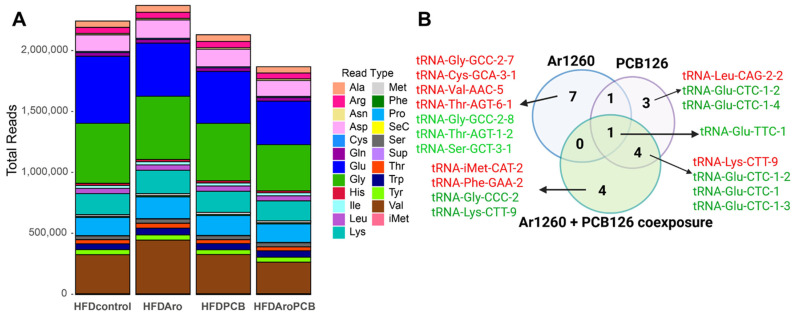
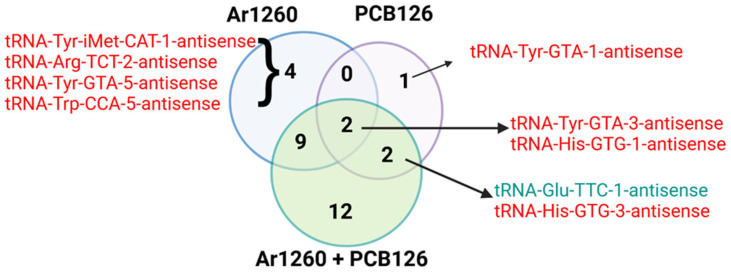
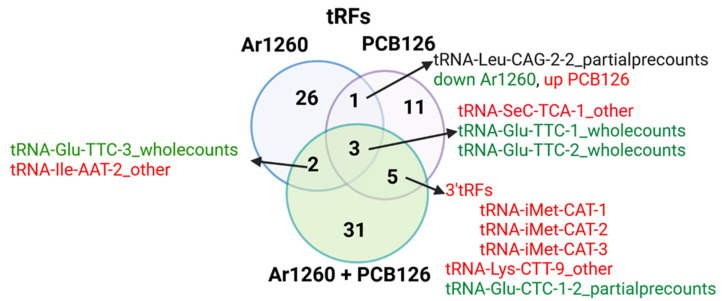
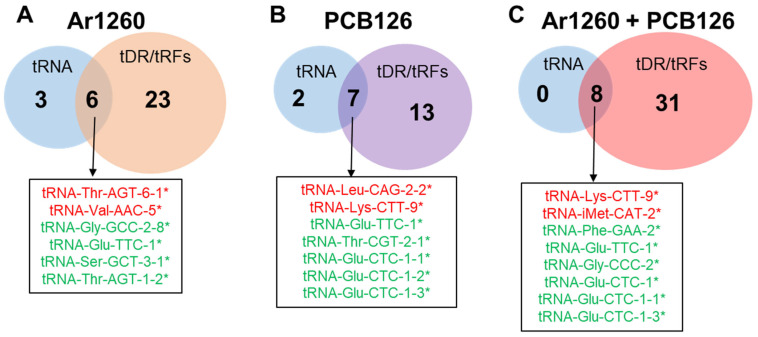
Background/Objectives: Exposure of high-fat diet (HFD)-fed mice to polychlorinated biphenyls (PCBs) results in metabolic dysfunction-associated steatotic liver disease (MASLD) and progression to metabolic dysfunction-associated steatohepatitis (MASH). The mechanisms by which HFD diet and PCBs increase MASLD are unclear. Previously, we identified differences in HFD-fed mouse liver tRNA modifications with single oral exposures to the dioxin-like PCB126, the non-dioxin-like PCB mixture Aroclor 1260 (Ar1260), or the combination of Ar1260 + PCB126. Methods: Here, we used small RNA sequencing and the tRNA analysis of expression (tRAX) pipeline to examine if PCB exposures alter the tRNA transcriptome, including tRNA-derived fragments (tRFs), in the livers of the PCB-exposed mice. Results: Each PCB exposure produced distinct hepatic tRNA transcriptomes with more tRNAs decreased than increased. Only tRNA-Glu-TTC-1 was reduced with all three PCB exposures. More changes in tRFs were identified with Ar1260 alone or in combination with PCB126 than with PCB126 alone. Four tRF-3s were upregulated in both PCB126 and Ar1260 + PCB126 co-exposed mice, suggesting PCB126 as responsible for this increase. We previously reported that PCB126 exposure increased hepatic Angiogenin (ANG) protein which generates tRF-3s. Four previously reported tRNA modifications corresponded to positions of PCB-associated tRNA modifications identified by tRAX: m1A, m6A, ms2t6A, and Ψ. Conclusions: Overall, the differences in hepatic tRNAs and tRFs with three different PCB exposures suggest that PCB exposures play an unexplored role in regulating translation in mouse liver.
Keywords: MASLD; PCBs; tRNA.
Conflict of interest statement
The authors declare no conflicts of interest.
Figures
Similar articles
-
The Role of tRNA Fragments on Neurogenesis Alteration by H₂O₂-induced Oxidative Stress.J Mol Neurosci. 2025 Apr 11;75(2):47. doi: 10.1007/s12031-025-02330-x. J Mol Neurosci. 2025. PMID: 40216606 Free PMC article.
-
Polychlorinated biphenyls alter hepatic m6A mRNA methylation in a mouse model of environmental liver disease.Environ Res. 2023 Jan 1;216(Pt 3):114686. doi: 10.1016/j.envres.2022.114686. Epub 2022 Oct 28. Environ Res. 2023. PMID: 36341798 Free PMC article.
-
Signs and symptoms to determine if a patient presenting in primary care or hospital outpatient settings has COVID-19.Cochrane Database Syst Rev. 2022 May 20;5(5):CD013665. doi: 10.1002/14651858.CD013665.pub3. Cochrane Database Syst Rev. 2022. PMID: 35593186 Free PMC article.
-
Interactions of Polychlorinated Biphenyls and Their Metabolites with the Brain and Liver Transcriptome of Female Mice.ACS Chem Neurosci. 2024 Nov 6;15(21):3991-4009. doi: 10.1021/acschemneuro.4c00367. Epub 2024 Oct 11. ACS Chem Neurosci. 2024. PMID: 39392776 Free PMC article.
-
Drugs for preventing postoperative nausea and vomiting in adults after general anaesthesia: a network meta-analysis.Cochrane Database Syst Rev. 2020 Oct 19;10(10):CD012859. doi: 10.1002/14651858.CD012859.pub2. Cochrane Database Syst Rev. 2020. PMID: 33075160 Free PMC article.
References
-
- Samala N., Kulkarni M., Lele R.S., Gripshover T.C., Lynn Wise J., Rai S.N., Cave M.C. Associations between per- and polyfluoroalkyl substance exposures and metabolic dysfunction associated steatotic liver disease (MASLD) in adult National Health and Nutrition Examination Survey 2017 to 2018. Toxicol. Sci. 2024;202:142–151. doi: 10.1093/toxsci/kfae106. - DOI - PMC - PubMed
-
- Tovoli F., Stefanini B., Mandrioli D., Mattioli S., Vornoli A., Sgargi D., Manservisi F., Piscaglia F., Curti S., Bolondi L. Exploring occupational toxicant exposures in patients with metabolic dysfunction-associated steatotic liver disease: A prospective pilot study. Dig. Liver Dis. 2024;56:571–578. doi: 10.1016/j.dld.2023.12.007. - DOI - PubMed
Grants and funding
- P30 ES030283/ES/NIEHS NIH HHS/United States
- P20 GM113226/GM/NIGMS NIH HHS/United States
- R21 ES031510/ES/NIEHS NIH HHS/United States
- R01 ES032189/ES/NIEHS NIH HHS/United States
- ES031510-01S1/NH/NIH HHS/United States
- P30ES030283, R35ES028373, R01ES032189, P42ES023716, P20GM113226; P20GM103436/NH/NIH HHS/United States
- PON2 415 1900002934/Kentucky Council on Postsecondary Education
- R35 ES028373/ES/NIEHS NIH HHS/United States
- P42 ES023716/ES/NIEHS NIH HHS/United States
- 5R21ES031510/NH/NIH HHS/United States
- P20 GM103436/GM/NIGMS NIH HHS/United States
LinkOut - more resources
Full Text Sources
Miscellaneous
