

Diagnostic Potential of Exosomal and Non-Exosomal Biomarkers in Lung Cancer: A Comparative Analysis Using a Rat Model of Lung Carcinogenesis
- PMID: 40559625
- PMCID: PMC12196065
- DOI: 10.3390/ncrna11030047
Diagnostic Potential of Exosomal and Non-Exosomal Biomarkers in Lung Cancer: A Comparative Analysis Using a Rat Model of Lung Carcinogenesis
Abstract
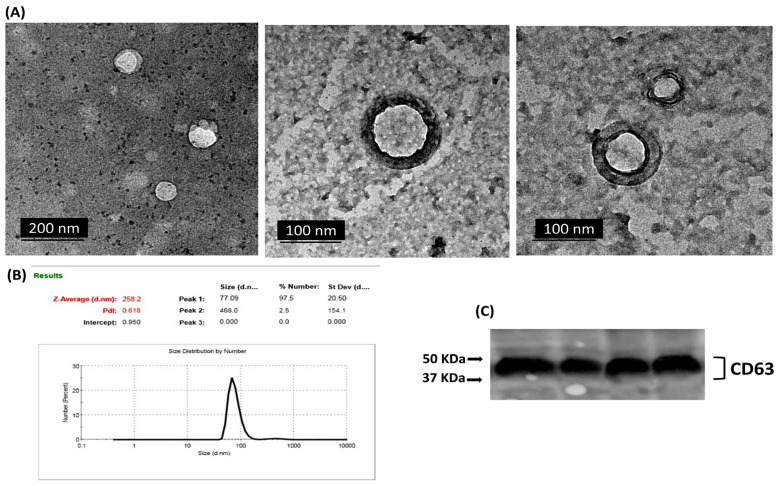
Background: Identifying liquid biopsy biomarkers with high efficacy is crucial for cancer diagnosis. Exosomal cargo, including miRNAs and proteins, offers enhanced stability in biofluids compared with their free circulating forms, but direct comparisons of their diagnostic performance remain limited. This study evaluates and compares the diagnostic value of selected miRNAs and protein markers in exosomal versus non-exosomal fractions across stages of lung carcinogenesis in a rat model.
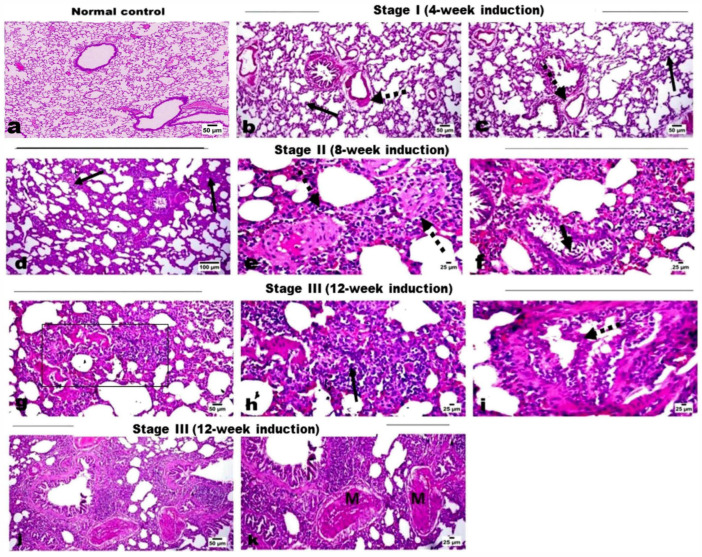
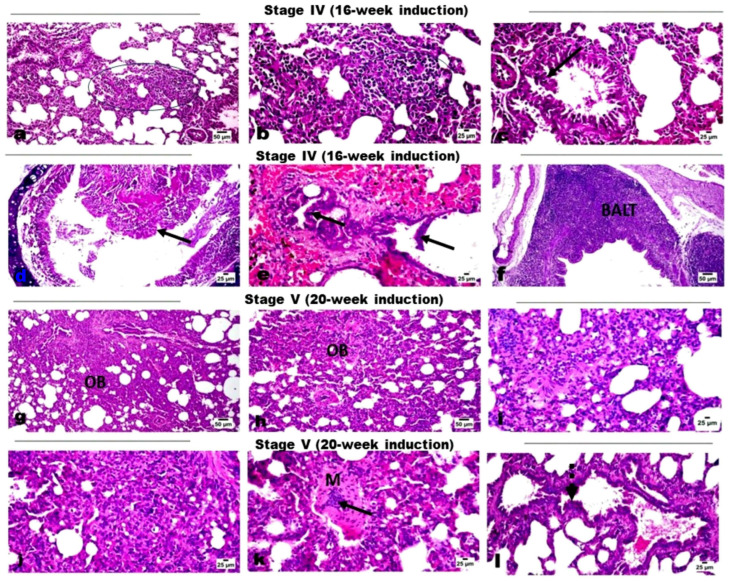
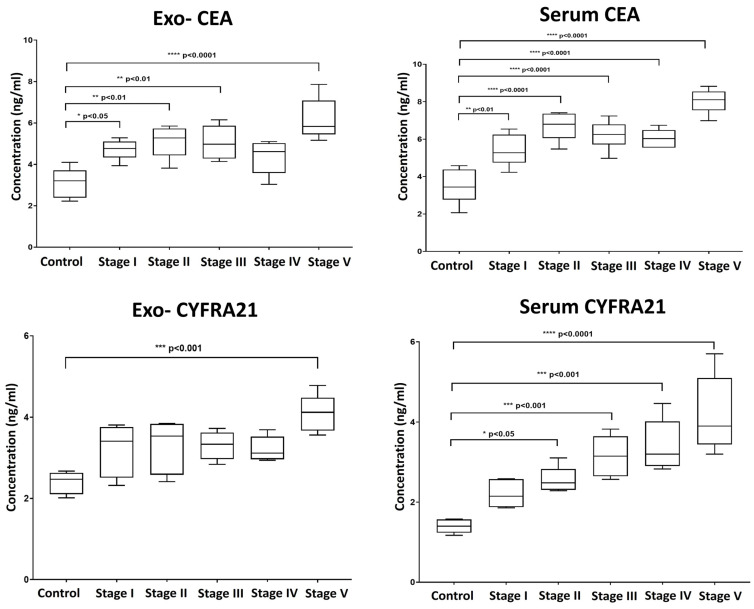
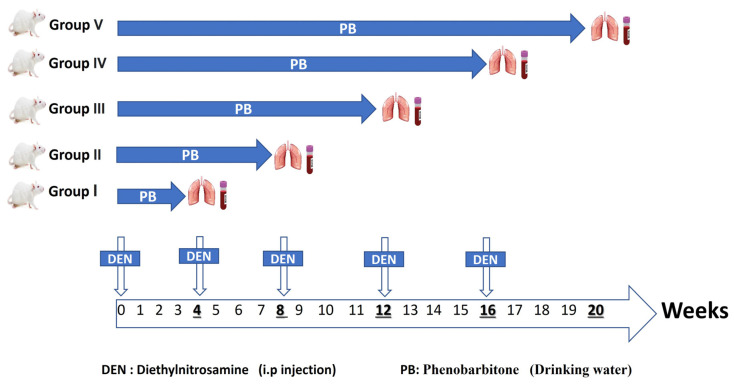
Methods: Lung cancer was induced in rats, and blood and lung tissue samples were collected at consecutive stages of tumor induction. We investigated the expression patterns of key miRNAs (miR-19b, miR-21, and miR-145) in exosomes, serum, and tissue and quantified levels of tumor biomarkers CEA and CYFRA 21-1 in exosomal and serum fractions.
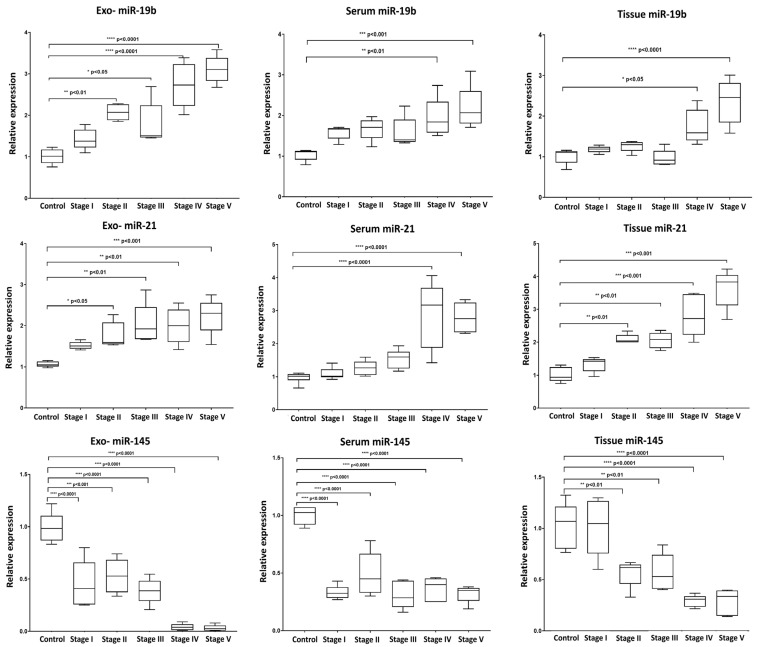
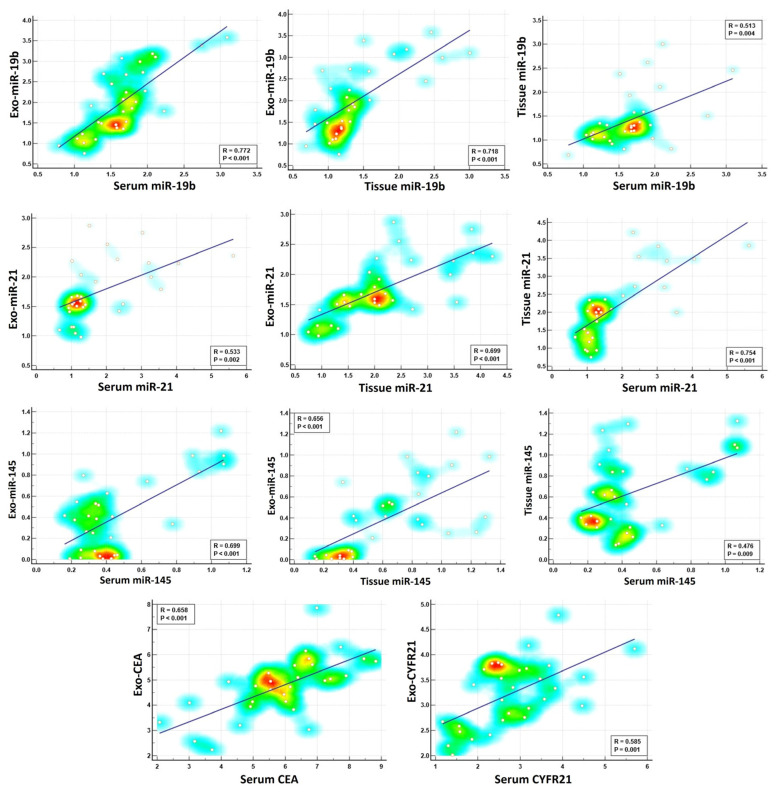
Results: Our results revealed distinct expression patterns of the evaluated miRNAs across exosomes, serum, and tissue, throughout different stages of tumor induction. The expression of exosomal miRNAs dynamically changed in parallel with the tumor induction process, demonstrating high diagnostic efficacy. Specifically, exosomal miR-19b and miR-21 were significantly upregulated from an early induction stage, whereas their serum and tissue forms increased only during the late stages of induction. On the other hand, miR-145 was consistently downregulated across all fractions at every stage. Both exosomal and serum CEA levels increased significantly during tumor induction, while serum CYFRA 21-1 outperformed its exosomal counterpart. Strong positive correlations linked exosomal miR-19b and miR-145 with their non-exosomal counterparts, while moderate correlations were seen for miR-21 and the protein markers.
Conclusions: Our findings underscore the value of integrating exosomal biomarkers in liquid biopsies, highlighting their potential to improve early detection and monitoring of lung cancer development.
Keywords: diagnosis; exosomes; extracellular vesicles; liquid biopsy; lung cancer; miRNAs; tumor marker.
Conflict of interest statement
The authors declare no conflicts of interest.
Figures
Similar articles
-
Evaluation of Organoid-Derived Exosomal microRNA as Liquid Biopsy for Colorectal Cancer: A Multicenter Cross-Sectional Study.Clin Transl Sci. 2025 Jun;18(6):e70270. doi: 10.1111/cts.70270. Clin Transl Sci. 2025. PMID: 40516061 Free PMC article.
-
Systemic pharmacological treatments for chronic plaque psoriasis: a network meta-analysis.Cochrane Database Syst Rev. 2021 Apr 19;4(4):CD011535. doi: 10.1002/14651858.CD011535.pub4. Cochrane Database Syst Rev. 2021. Update in: Cochrane Database Syst Rev. 2022 May 23;5:CD011535. doi: 10.1002/14651858.CD011535.pub5. PMID: 33871055 Free PMC article. Updated.
-
Association of exosomal miR17-92a cluster and target genes with breast cancer risk.Future Oncol. 2025 Jul 29:1-16. doi: 10.1080/14796694.2025.2539627. Online ahead of print. Future Oncol. 2025. PMID: 40728024
-
Systemic pharmacological treatments for chronic plaque psoriasis: a network meta-analysis.Cochrane Database Syst Rev. 2017 Dec 22;12(12):CD011535. doi: 10.1002/14651858.CD011535.pub2. Cochrane Database Syst Rev. 2017. Update in: Cochrane Database Syst Rev. 2020 Jan 9;1:CD011535. doi: 10.1002/14651858.CD011535.pub3. PMID: 29271481 Free PMC article. Updated.
-
The miR-21-5p, miR-30c-5p, and miR-182-5p as Biomarkers in Clear Cell Renal Cell Carcinoma: A Southeastern Romanian Cohort Study.Genes (Basel). 2025 May 28;16(6):650. doi: 10.3390/genes16060650. Genes (Basel). 2025. PMID: 40565542 Free PMC article.
References
-
- Kratzer T.B., Bandi P., Freedman N.D., Smith R.A., Travis W.D., Jemal A., Siegel R.L. Lung Cancer Statistics. Cancer. 2023;2024:130. - PubMed
Grants and funding
LinkOut - more resources
Full Text Sources
