. 2025 Jun 4;9(2):48.
doi: 10.3390/vision9020048.

Oculomotor-Related Measures Are Predictive of Reading Acquisition in First Grade Early Readers

Affiliations

Oculomotor-Related Measures Are Predictive of Reading Acquisition in First Grade Early Readers

Avi Portnoy et al. Vision (Basel). .

Abstract

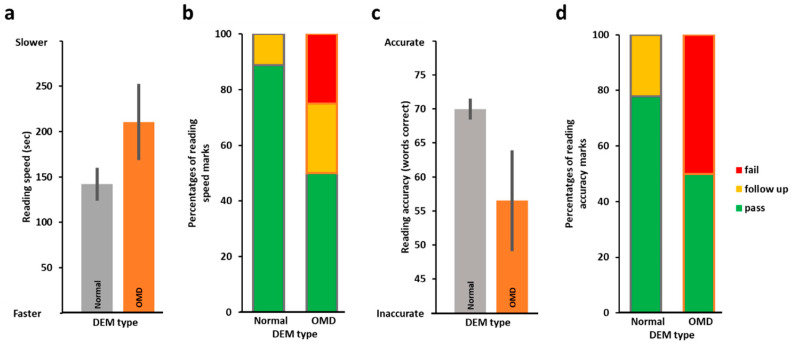
Some estimates suggest that one in seven good readers and the majority of children with reading difficulties suffer from oculomotor dysfunction (OMD), an umbrella term for abnormalities in comfortable and accurate fixations, pursuits, and saccades. However, national vision evaluation programs worldwide are often limited to distance visual acuity (dVA), not testing for OMD despite its high prevalence and the ease of detecting it in brief optometric evaluations. We hypothesized that reading acquisition is dependent on good oculomotor functions, and therefore inadequate oculomotor control will be associated with reading difficulties. We retrospectively examined and compared oculomotor evaluations (using DEM and NSUCO) and reading assessments (using standardized national reading norms) of a normative class (28 first graders (6-7 yr. olds)) that were independently obtained while blind to the other assessment. Better oculomotor performance as estimated by DEM was associated with better reading performance, and almost a third (29.6%) of the children were categorized by DEM as having OMD-related difficulties. Control analysis revealed dVA was not positively associated with reading performance. Linear regression analyses further corroborated these findings. Since this study is based on a small cohort and since there are studies suggesting that DEM may actually reflect visual processing speed or cognitive factors rather than oculomotor function, replications are needed to substantiate the direct contribution of oculomotor functions to reading acquisition. Young children struggling with reading may benefit from a comprehensive visual evaluation, including oculomotor testing, to provide a more thorough assessment of their learning-related difficulties.

Keywords: oculomotor dysfunction; oculomotor function; optometric evaluations; reading; vision; visual acuity.


Conflict of interest statement

The authors declare that the research was conducted in the absence of any commercial or financial relationships that could be construed as a potential conflicts of interest.

Figures

Figure 1
Figure 1
Faster reading speed and better reading grades for faster DEM performers (n = 26). (a) Average reading time in seconds for slower (orange, on right, n = 13) and faster (grey, on left, n = 13) horizontal DEM performers; the faster horizontal DEM performers were found to be significantly faster in their reading performance (t(18.54) = 2.63, p = 0.008, 1-tailed). DEM speed performance is standardized and based on the duration in seconds to complete the task (see https://osf.io/shw2v/ (accessed on 30 May 2025) for the individual data and corresponding standardized scores). (b) Proportions of reading speed categorization (pass in green, demands follow-up in yellow, or fail in red) for the slower DEM performers (n = 13, right) and the faster DEM performers (n = 13, left). (c,d) Same analysis as in (a,b) but for vertical DEM speed, the faster vertical DEM performers were found to be significantly faster in their reading performance (t(18.53) = 2.76, p = 0.006, 1-tailed). Note that there were no fails for the reading speed test in both the faster vertical and faster horizontal DEM groups. Asterisks denote p < 0.01, error bars, SEM.
Figure 2
Figure 2
Reading accuracy according to DEM accuracy (standardized, based on error scores) (n = 26). (a) Average number of words read correctly (out of 77) by the more accurate (grey, n = 13, left) vs. the less accurate (orange, n = 13, right) DEM performers were not significantly different (t(16.264) = −1.31, p = 0.104, 1-tailed). DEM accuracy performance is standardized and based on the number of errors made (see https://osf.io/shw2v/, accessed on 30 May 2025, for the individual data of errors and corresponding standardized accuracy scores). (b) Proportions of reading accuracy categorization scores (pass in green, demands follow-up in yellow, fail in red) by DEM accuracy performance. These data tend to suggest that the more accurate DEM group (left column) may receive better reading grades. Error bars, SEM.
Figure 3
Figure 3
Difficulty in reading (−1 SD) based on DEM performance: ROC analysis. True positive rate (TPR, y-axis) as a function of false positive rate (FPR, x-axis) for predicting difficulty in reading based on DEM performance. Difficulty in reading was defined for “demands follow-up” or “fail” reading scores, which correspond to −1 SD or worse performance. (a) DEM horizontal speed performance significantly differentiated children with vs. children without reading speed difficulty (AUC = 0.7074, 95% CI: 0.5049–0.9098). (b) DEM vertical speed performance significantly differentiated children with vs. children without reading speed difficulty (AUC = 0.7869, 95% CI: 0.5959–0.9779). (c) DEM accuracy did not successfully differentiate children with vs. children without reading accuracy difficulty (AUC = 0.5398, 95% CI: 0.3113–0.7682). See Results for further details.
Figure 4
Figure 4
Percentages of children found in each DEM classification type (n = 27). The grey section (33.3%, n = 9) represents normal language automaticity and oculomotor function (DEM Type 1). Orange shades represent DEM types associated with OMD (29.6%, n = 8), with darker orange (18.5%, n = 5) representing children categorized by DEM as having normal language automaticity with oculomotor dysfunction (Type 2) and lighter orange section (11.1%, n = 3) representing DEM performance categorized as a combination of both oculomotor and language automaticity dysfunctions (Type 4). The blue section (22.2%, n = 6) represents abnormal language automaticity function but normal oculomotor function (Type 3). The white section (14.8%, n = 4) represents DEM performance that cannot be categorized according to the DEM protocols, possibly due to other visual factors such as accommodative or binocular dysfunctions.
Figure 5
Figure 5
Reading speed and accuracy performance according to DEM Type categorization (n = 17). (a) Average reading speed in seconds as performed by the normal DEM group (grey Type 1 on left, n = 9) and the OMD DEM groups (orange, Types 2 and 4 on right, n = 8). As can be seen, the normal DEM group was on average faster in their reading performance (marginally significant, see Results). (b) Proportions of reading speed categorization (‘pass’ in green, ‘demands follow-up’ in yellow, or ‘fail’ in red) for the normal DEM group on left and the OMD DEM groups on the right. (c,d) Same analysis as in (a,b) but for reading accuracy. Note that there was no fail for either reading speed or accuracy in the normal (Type 1) DEM group. Error bars, SEM.
Figure 6
Figure 6
Reading accuracy performance according to standardized optometric NSUCO subscore that grades the amount of head movement resulting from saccades (n = 27). (a) Average number of words read correctly as performed by the age-appropriate NSUCO head movement group (grey, n = 15) and below age-appropriate (orange) group (orange, n = 12). The age-appropriate group was more accurate on average in their reading. (b) Proportions of reading accuracy categorization (‘pass’, ‘demands follow-up’, or ‘fail’) for both groups. Error bars, SEM.
Figure 7
Figure 7
Reading performance in children with better and poorer dVA (n = 26). (a) The Y-axis represents reading time in seconds. The right orange bar depicts reading speed (in words per minute) of the below-average dVA (<6/6) group (n = 10), and the left grey column that of the average dVA (6/6) group (n = 16). Reading speed of the better acuity group was significantly slower than that of the poorer acuity group (t(23.284) = −2.22, p = 0.037, 2-tailed). (b) Similar to (a) with Y-axis representing the number of words read accurately out of the 77 words in the test. Reading accuracy performance of the better acuity group was significantly less accurate than that of the group with less than average (<6/6) dVA (t(17.363) = 2.82, p = 0.012, 2-tailed). (c) The stacked bar chart displays proportions of reading speed categorization (‘pass’ in green, ‘demands follow up’ in yellow, ‘fail’ in red), right bar—reading score distribution of the less than average dVA group, left bar—similarly for the normal dVA group. Note that there were no ‘fails’ in the <6/6 group and the ‘pass’ rate was higher than in the 6/6 group. (d) Same analysis as in (c) but for reading accuracy. Asterisks, p < 0.05, error bars, SEM.

Similar articles

References

    1. The Annie E. Casey Foundation Kids Count Data Book: State Trends in Child Well-Being. Baltimore MD. 2024. [(accessed on 28 July 2024)]. Available online: https://assets.aecf.org/m/resourcedoc/aecf-2024kidscountdatabook-2024.pdf.
    1. Hernandez D.J. Double Jeopardy: How Third-Grade Reading Skills and Poverty Influence High School Graduation. Annie E Casey Foundation; Baltimore, MD, USA: 2011.
    1. Tassinari J.T. Untreated Oculomotor Dysfunction. Optom. Vis. Dev. 2007;38:121
    1. Scheiman M., Wick B. Clinical Management of Binocular Vision: Heterophoric, Accommodative, and Eye Movement Disorders. Lippincott Williams & Wilkins; Philadelphia, PA, USA: 2015.
    1. Hoffman L.G. Incidence of vision difficulties in children with learning disabilities. J. Am. Optom. Assoc. 1980;51:447–451. - PubMed

LinkOut - more resources