. 2025 Jun 17;10(6):170.
doi: 10.3390/tropicalmed10060170.

Epidemiological Analysis of the COVID-19 Clusters in the Early Stages of the Epidemic in Shanghai, China: Pandemic-to-Epidemic Response Shift

Affiliations

Epidemiological Analysis of the COVID-19 Clusters in the Early Stages of the Epidemic in Shanghai, China: Pandemic-to-Epidemic Response Shift

Dechuan Kong et al. Trop Med Infect Dis. .

Abstract

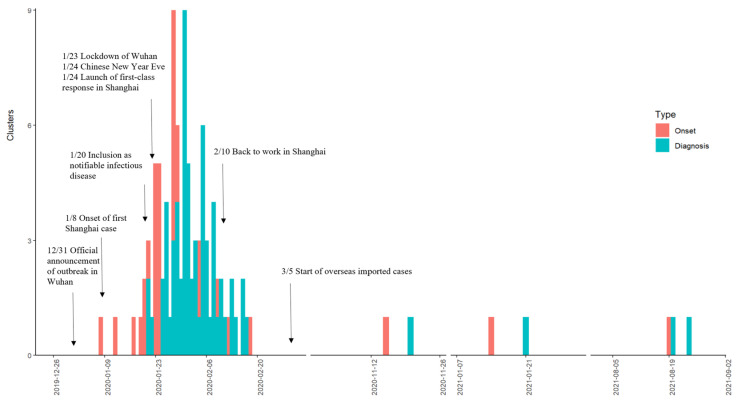
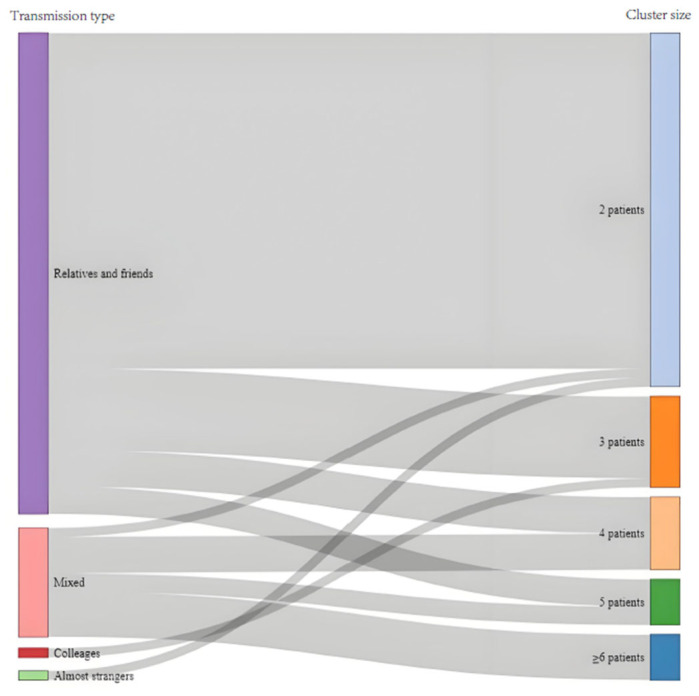
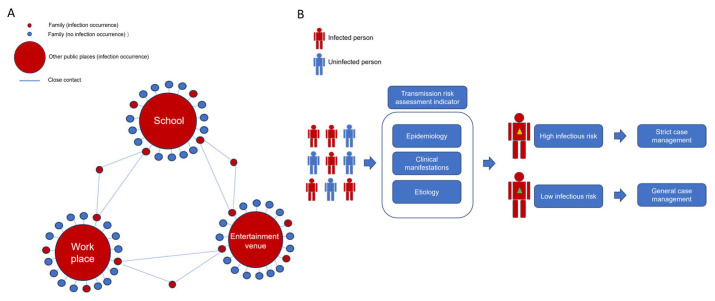
As COVID-19 transitions from pandemic to endemic, our prevention and control policies have shifted from broad, strict community interventions to focusing on the prevention of cluster outbreaks. Currently, information on the characteristics of cluster outbreaks remains limited. This study describes the features of COVID-19 clusters in Shanghai. It aims to provide valuable insights for managing localized outbreaks. We conducted a retrospective analysis of clusters of confirmed COVID-19 cases. Epidemiological descriptions, the transmission characteristics of clusters, and individual risk factors for contagiousness were analyzed. A total of 381 cases of COVID-19 were confirmed and 67 clusters were identified. Most clusters (58.21%, 39/67) only had two cases, with a declining proportion held by clusters of more cases. Familial transmission was predominant, accounting for 79.10% (53/67) of clusters. Although other types of cluster outbreaks, such as those in workplaces (1.49%, 1/67), occur less frequently compared to household clusters, they tend to involve larger scales and more cases. Workplaces and similar venues are more likely to experience large-scale cluster outbreaks. Contagiousness was higher among cases with runny nose (risk ratio [RR]: 4.8, 95% CI: 1.40-16.44, p-value = 0.01) and those with diabetes (RR: 3.8, 95% CI: 1.01-14.60, p-value = 0.05). In conclusion, household cluster outbreaks, in particular, are both a key priority and a foundational issue. Establishing an indicator system based on the transmissibility of cases holds significant practical value for infectious disease prevention and control. By enhancing household hygiene and developing a case classification and management system based on transmissibility, it is possible to better prevent and control regional COVID-19 outbreaks.

Keywords: COVID-19; clusters; epidemiology; outbreak; transmission.


Conflict of interest statement

The authors declare no conflicts of interest.

Figures

Figure 1
Figure 1
Timelines and characteristics of 67 COVID-19 clusters in the early stages of the epidemic in Shanghai.
Figure 2
Figure 2
Transmission features of clusters in Shanghai. This Sankey diagram visualizes the relationship between transmission type and cluster size observed in the early stage of COVID-19 pandemic in Shanghai. Left side refers to the contact pattern and social relations of the cases in the cluster, including relatives and friends, colleagues, almost strangers, and combination of these patterns (mixed). Right side refers to the number of patients involved in the cluster. The gray bands show each connection indicating the cluster size of the certain transmission type.
Figure 3
Figure 3
Conceptual diagram (A): The key bridging role of families in the transmission of COVID-19. The schematic employs a standardized visual encoding system where (1) chromatic coding distinguishes infection status (red = infected, blue = uninfected), (2) topological scaling represents outbreak magnitude (circle diameter = case count), and (3) geometric relationships depict transmission pathways. Specifically: small red circles denote infected family, large red circles indicate infected public venues, blue circles represent unaffected locations, and blue lines trace close-contact transmission chain. (B): Classification and management of COVID-19-infected individuals based on the transmission risk assessment indicator system. The schematic employs a dual-coding system to visualize transmission dynamics: (1) chromatic differentiation (red human figures = infected, blue human figures = uninfected), and (2) transmission risk stratification (yellow triangle = high-risk cases requiring strict containment measures; green triangle = low-risk cases managed measures).

Similar articles

References

    1. Tahir M.J., Sawal I., Essar M.Y., Jabbar A., Ullah I., Ahmed A. Disease X: A hidden but inevitable creeping danger. Infect. Control Hosp. Epidemiol. 2022;43:1758–1759. doi: 10.1017/ice.2021.342. - DOI - PMC - PubMed
    1. Jiang S., Shi Z.-L. The First Disease X is Caused by a Highly Transmissible Acute Respiratory Syndrome Coronavirus. Virol. Sin. 2020;35:263–265. doi: 10.1007/s12250-020-00206-5. - DOI - PMC - PubMed
    1. Hu B., Guo H., Si H., Shi Z. Emergence of SARS and COVID-19 and preparedness for the next emerging disease X. Front. Med. 2024;18:1–18. doi: 10.1007/s11684-024-1066-6. - DOI - PubMed
    1. Awasthi R. Disease X: Beyond Fear, Toward Preparedness. Infect. Disord. Drug Targets. 2024;24:e230124226003. doi: 10.2174/0118715265285021240104091449. - DOI - PubMed
    1. Ulrichs T., Rolland M., Wu J., Nunes M.C., El Guerche-Séblain C., Chit A. Changing epidemiology of COVID-19: Potential future impact on vaccines and vaccination strategies. Expert Rev. Vaccines. 2024;23:510–522. doi: 10.1080/14760584.2024.2346589. - DOI - PubMed

LinkOut - more resources