Variability of Mercury Concentrations Across Species, Brand, and Tissue Type in Processed Commercial Seafood Products
- PMID: 40559900
- PMCID: PMC12196803
- DOI: 10.3390/toxics13060426
Variability of Mercury Concentrations Across Species, Brand, and Tissue Type in Processed Commercial Seafood Products
Abstract
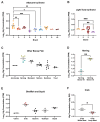
Mercury (Hg) is a global health concern due to its prevalence, persistence, and toxicity. Numerous studies have assessed Hg concentrations in seafood, but variability in reported concentrations highlights the need for continued monitoring and stricter regulations. We measured total Hg (tHg) in 148 pre-processed, packaged seafood products purchased in Raleigh, North Carolina, using thermal decomposition-gold amalgamation atomic absorption spectrophotometry. Products were grouped into three categories based on trophic ecology and physiology: (1) tuna, (2) other bony fish, and (3) shellfish and squid. Among tuna, albacore had the highest average tHg (396.4 ng/g ± 172.1), while yellowfin had the lowest (68.3 ng/g ± 64.7). Herring (54.0 ng/g ± 23.2) and crab (78.2 ng/g ± 24.1) had the highest concentrations in the other two groups. One can of albacore exceeded the FDA action level of 1 part per million (1.3 ppm or 1300 ng/g). Brand differences were significant for both albacore and light tuna, with Brand 1 consistently showing higher Hg levels. Comparisons to FDA data (1990-2012) suggest Hg concentrations in tuna have remained stable over the past two decades. This study underscores the variability of Hg concentrations across species and brands and the need for continued monitoring to protect consumers.
Keywords: canned food; fish; mercury; seafood; tuna.
Conflict of interest statement
Author Leah Segedie is employed by Bookieboo LLC, DBA “MAMAVATION.com”. The remaining authors declare that the research was conducted in the absence of any commercial or financial relationships that could be construed as a potential conflict of interest.
Figures


References
-
- WHO Mercury and Health. 2017. [(accessed on 18 February 2025)]. Available online: https://www.who.int/news-room/fact-sheets/detail/mercury-and-health.
-
- WHO 10 Chemicals of Public Health Concern. 2020. [(accessed on 18 February 2025)]. Available online: https://www.who.int/news-room/photo-story/detail/10-chemicals-of-public-....
-
- Beckers F., Rinklebe J. Cycling of mercury in the environment: Sources, fate, and human health implications: A review. Crit. Rev. Environ. Sci. Technol. 2017;47:693–794. doi: 10.1080/10643389.2017.1326277. - DOI
-
- Basic Information about Mercury|US EPA. [(accessed on 18 February 2025)]; Available online: https://www.epa.gov/mercury/basic-information-about-mercury.
Grants and funding
LinkOut - more resources
Full Text Sources
Miscellaneous

