

Ozone Aggravated the Toxicity of Fine Particulate Matter by Impairing Membrane Stability and Facilitating Particle Internalization
- PMID: 40559919
- PMCID: PMC12197588
- DOI: 10.3390/toxics13060446
Ozone Aggravated the Toxicity of Fine Particulate Matter by Impairing Membrane Stability and Facilitating Particle Internalization
Abstract
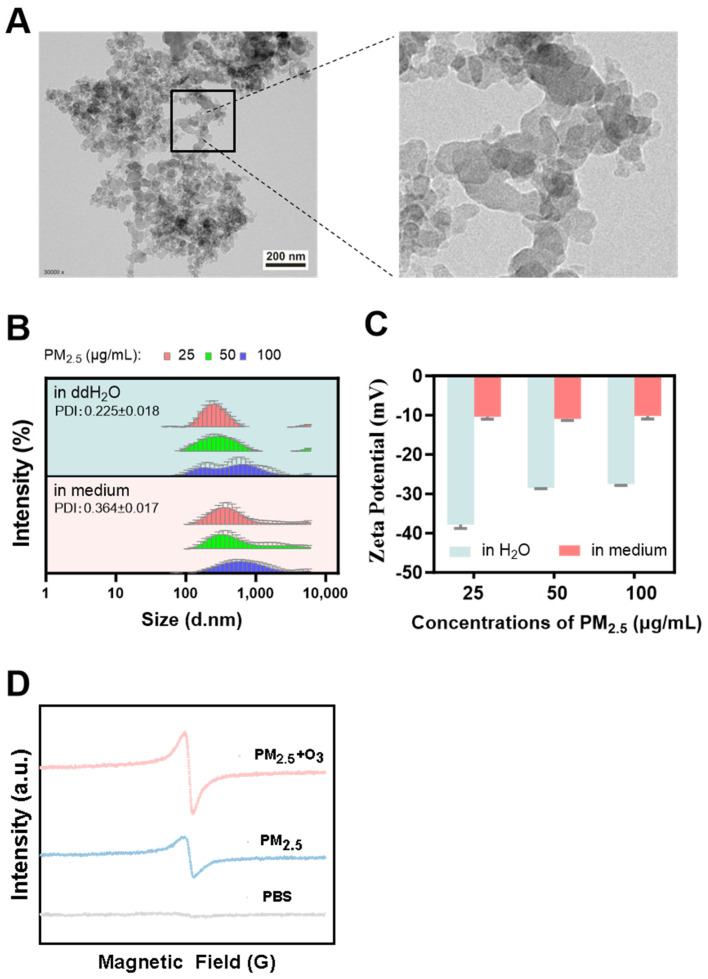
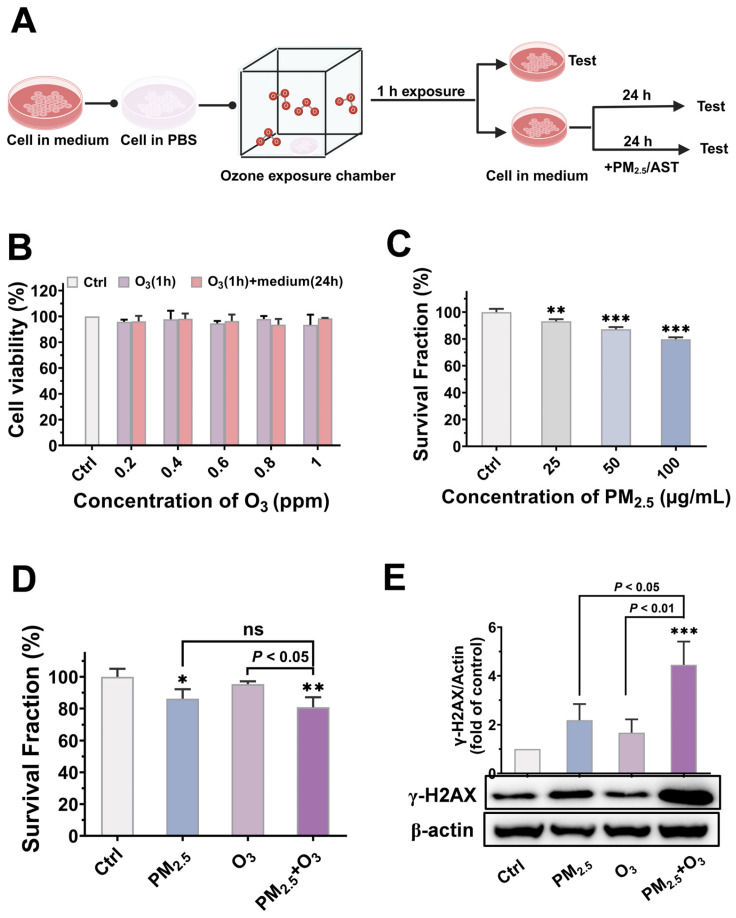
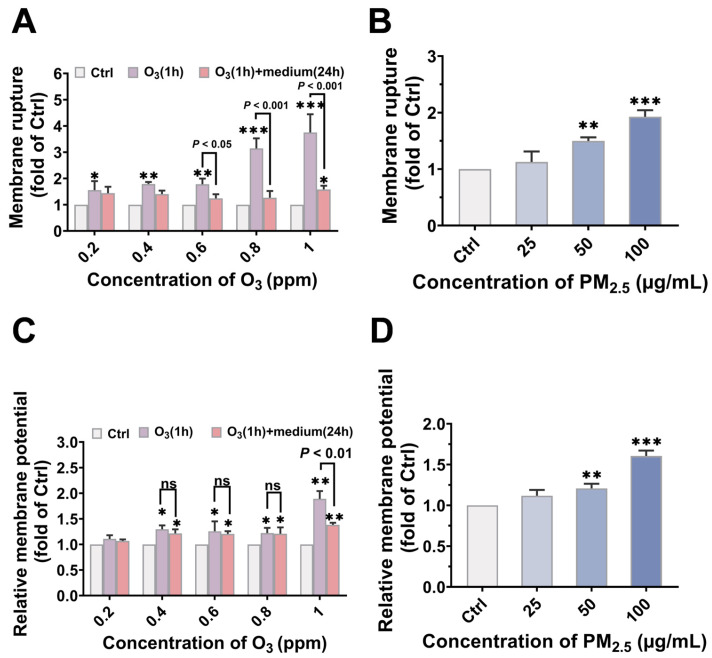
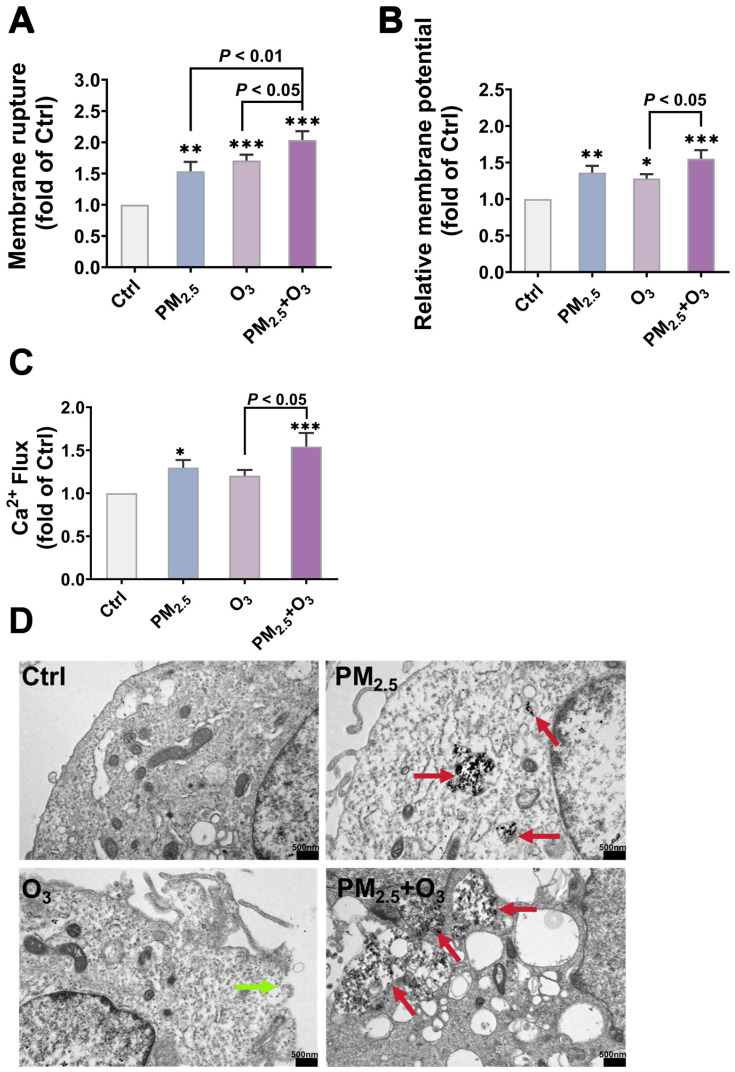
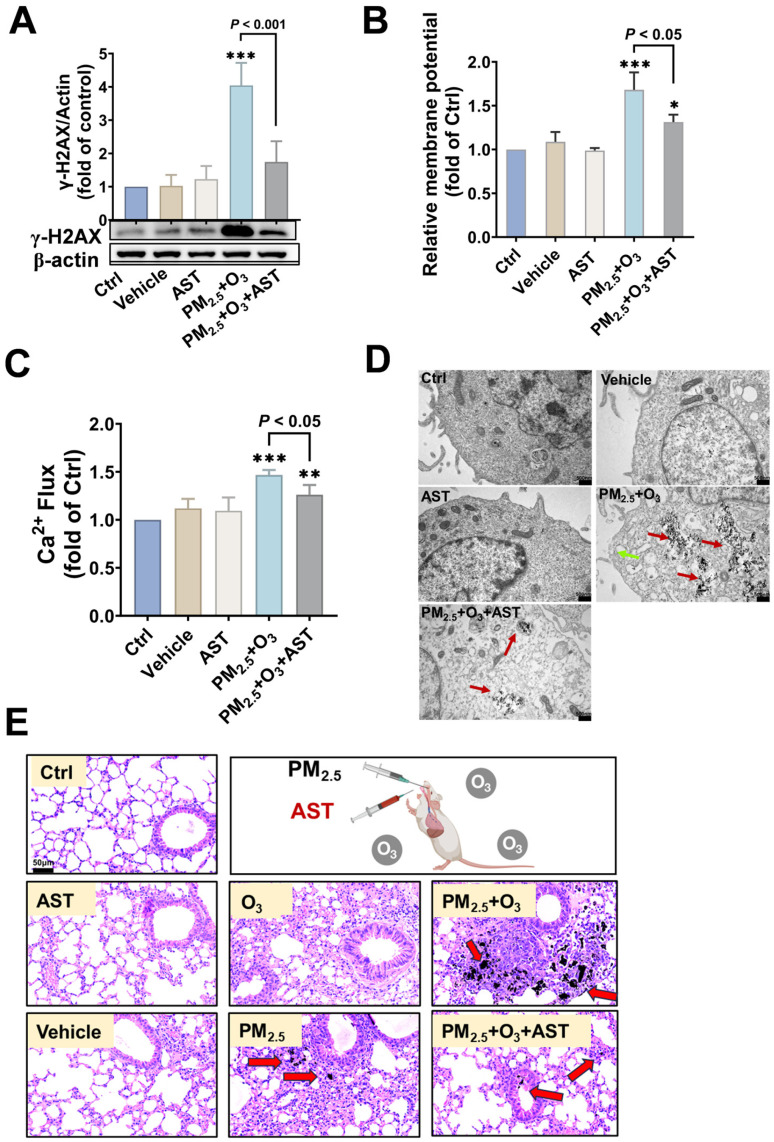
The combined pollution of fine particulate matter (PM2.5) and ozone (O3) is increasing synergistically on a global scale, posing a serious threat to human health. However, the joint toxicity and the underlying mechanisms associated with co-exposure to PM2.5 and O3 remain poorly understood. Through complementary in vivo animal models and in vitro cellular assays, the results demonstrate that although there was no synergistic cytotoxicity effect between PM2.5 and O3, the presence of O3 significantly enhanced the genotoxicity of PM2.5 by inducing severe DNA double-strand breaks. Furthermore, O3 exposure significantly exacerbated the bioaccumulation of PM2.5 by disturbing the cellular membrane integrity, thus leading to synergistic toxicity in bronchial cells and mouse lungs. Astaxanthin (AST) effectively antagonized the adverse effects of PM2.5 and O3 co-exposure by maintaining cell membrane integrity. These findings enhance our understanding of the pathophysiological mechanisms induced by co-exposure to PM2.5 and O3, and provide a promising therapeutic strategy for treating respiratory diseases caused by unavoidable exposure to these pollutants.
Keywords: cell membrane damage; detoxification; fine particulate matter; joint toxicity; ozone.
Conflict of interest statement
The authors declare that they have no known competing financial interests or personal relationships that could have appeared to influence the work reported in this paper.
Figures
Similar articles
-
Long-term exposure to ambient O3 and PM2.5 is associated with reduced cognitive performance in young adults: A retrospective longitudinal repeated measures study in adults aged 18-90 years.Environ Pollut. 2023 Mar 1;320:121085. doi: 10.1016/j.envpol.2023.121085. Epub 2023 Jan 13. Environ Pollut. 2023. PMID: 36642175 Free PMC article.
-
Long-Term Air Pollution Exposure and Severity of Idiopathic Pulmonary Fibrosis: Data from the Idiopathic Pulmonary Fibrosis Prospective Outcomes (IPF-PRO) Registry.Ann Am Thorac Soc. 2025 Mar;22(3):378-386. doi: 10.1513/AnnalsATS.202404-382OC. Ann Am Thorac Soc. 2025. PMID: 39531618
-
Association between ambient air pollution and thyroid hormones levels: A systematic review and meta-analysis.Sci Total Environ. 2023 Dec 15;904:166780. doi: 10.1016/j.scitotenv.2023.166780. Epub 2023 Sep 3. Sci Total Environ. 2023. PMID: 37660827
-
Air pollution exposure and heart failure: A systematic review and meta-analysis.Sci Total Environ. 2023 May 10;872:162191. doi: 10.1016/j.scitotenv.2023.162191. Epub 2023 Feb 11. Sci Total Environ. 2023. PMID: 36781139
-
Association between short-term exposure to ambient air pollution and biomarkers of coagulation: A systematic review and meta-analysis.Environ Res. 2022 Dec;215(Pt 1):114210. doi: 10.1016/j.envres.2022.114210. Epub 2022 Aug 27. Environ Res. 2022. PMID: 36030918
References
-
- WHO . Ambient (Outdoor) Air Pollution. World Health Organization; Geneva, Switzerland: 2024. [(accessed on 16 November 2024)]. Available online: https://www.who.int/news-room/fact-sheets/detail/ambient-(outdoor)-air-q....
-
- Wang B., Sun M., Si L., Niu Z. Spatio-temporal variation of O3 concentration and exposure risk assessment in key regions of China, 2015–2021. Atmos. Pollut. Res. 2024;15:101941. doi: 10.1016/j.apr.2023.101941. - DOI
Grants and funding
LinkOut - more resources
Full Text Sources
