

Hippocampal Proteomics Reveals the Novel Molecular Profiling of Postnatal Lead (Pb) Exposure on Autism-like Behaviors
- PMID: 40559938
- PMCID: PMC12197489
- DOI: 10.3390/toxics13060465
Hippocampal Proteomics Reveals the Novel Molecular Profiling of Postnatal Lead (Pb) Exposure on Autism-like Behaviors
Abstract
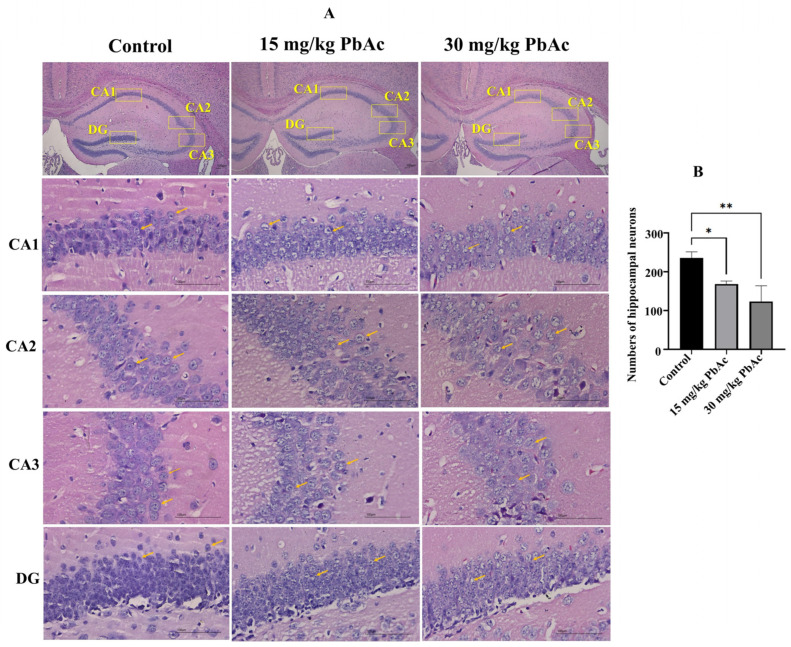
Autism spectrum disorder (ASD) is a multifactorial neurodevelopmental disorder, with lead (Pb) exposure increasingly linked to its risk. However, the molecular mechanisms linking Pb to ASD remain poorly understood. This study established a postnatal Pb-exposed mouse model and employed the three-chamber social test and the marble-burying test to assess ASD-like behavioral phenotypes. The Pb levels in both blood and the hippocampus were quantified, and hippocampal neurons were assessed for morphological alterations. Moreover, a Tandem Mass Tag (TMT)-based quantitative proteomics approach was applied to elucidate the underlying mechanisms. Neurobehavioral experiments revealed Pb-exposed C57BL/6 offspring exhibited reduced social interaction and novelty preference along with increased repetitive marble-burying behavior. The Pb levels in both the blood and hippocampus of Pb-treated mice were significantly elevated compared with those of control animals. Postnatal Pb exposure resulted in a reduction in the neuronal numbers and disorganized neuronal arrangement in the hippocampus. A total of 66 proteins were identified as being differentially expressed after postnatal Pb exposure. Among them, 34 differentially expressed proteins were common in both Pb exposure groups, with 33 downregulated and 1 upregulated. Bioinformatic analysis revealed multi-pathway regulation involved in Pb-induced neurodevelopmental disorders, including dysregulation of synaptic signaling, abnormal activation of neuron apoptosis, and neuroinflammation. Notably, the SYT10/IGF-1 signaling pathway may play a potential key role. These findings enhance understanding of Pb-induced autism-like behaviors, providing novel proteomic insights into the etiology of ASD.
Keywords: autism spectrum disorder (ASD); hippocampus; lead (Pb); postnatal; proteomics.
Conflict of interest statement
The authors declare no conflicts of interest.
Figures


Similar articles
-
Effects of Cannabidiol Isolated or in Association With Risperidone in an Animal Model of Autism.Dev Neurobiol. 2025 Jan;85(1):e22955. doi: 10.1002/dneu.22955. Dev Neurobiol. 2025. PMID: 39604124
-
Home treatment for mental health problems: a systematic review.Health Technol Assess. 2001;5(15):1-139. doi: 10.3310/hta5150. Health Technol Assess. 2001. PMID: 11532236
-
Hippocampal Morphological Alterations and Oxidative Stress in Autism Spectrum Disorder Model Induced by Prenatal Exposure to Valproic Acid in Male and Female Mice.Hippocampus. 2025 Jul;35(4):e70024. doi: 10.1002/hipo.70024. Hippocampus. 2025. PMID: 40626515
-
Methylphenidate for children and adolescents with autism spectrum disorder.Cochrane Database Syst Rev. 2017 Nov 21;11(11):CD011144. doi: 10.1002/14651858.CD011144.pub2. Cochrane Database Syst Rev. 2017. PMID: 29159857 Free PMC article.
-
Spironolactone Partially Reverses Autism-Like Behaviors Linked to ErbB4 and mTOR Phosphorylation in the Mouse Prefrontal Cortex and Striatum.Arch Med Res. 2025 Jul 10;56(7):103254. doi: 10.1016/j.arcmed.2025.103254. Online ahead of print. Arch Med Res. 2025. PMID: 40644788
References
-
- Maenner M.J., Warren Z., Robinson Williams A., Amoakohene E., Bakian A.V., Bilder D.A., Durkin M.S., Fitzgerald R.T., Furnier S.M., Hughes M.M., et al. Prevalence and Characteristics of Autism Spectrum Disorder Among Children Aged 8 Years-Autism and Developmental Disabilities Monitoring Network, 11 Sites, United States, 2020. MMWR Surveill. Summ. 2023;72:14. doi: 10.15585/mmwr.ss7202a1. - DOI - PMC - PubMed
-
- Zhou H., Xu X., Yan W., Zou X., Wu L., Luo X., Li T., Huang Y., Guan H., Chen X., et al. Prevalence of Autism Spectrum Disorder in China: A Nationwide Multi-center Population-based Study Among Children Aged 6 to 12 Years. Neurosci. Bull. 2020;36:961–971. doi: 10.1007/s12264-020-00530-6. - DOI - PMC - PubMed
-
- Smith M.R., Yevoo P., Sadahiro M., Austin C., Amarasiriwardena C., Awawda M., Arora M., Dudley J.T., Morishita H. Inte grative bioinformatics identifies postnatal lead (Pb) exposure disrupts developmental cortical plasticity. Sci. Rep. 2018;8:12. doi: 10.1038/s41598-018-34592-4. - DOI - PMC - PubMed
Grants and funding
- 3502Z20224ZD1298/Xiamen Medical and Health Guidance Project
- 3502Z20227076/Natural Science Foundation of Xiamen
- 2021J01345, 2022J011404, 2024J011397/Natural Science Foundation of Fujian Province of China
- K2022-10/Foundation of Xiamen Medical College
- 202312631002/National College Students' Innovation and Entrepreneurship Training Program Project
LinkOut - more resources
Full Text Sources
