. 2025 May 22;13(2):17.
doi: 10.3390/proteomes13020017.

Integrative Spatial Proteomics and Single-Cell RNA Sequencing Unveil Molecular Complexity in Rheumatoid Arthritis for Novel Therapeutic Targeting

Affiliations

Integrative Spatial Proteomics and Single-Cell RNA Sequencing Unveil Molecular Complexity in Rheumatoid Arthritis for Novel Therapeutic Targeting

Xue Wang et al. Proteomes. .

Abstract

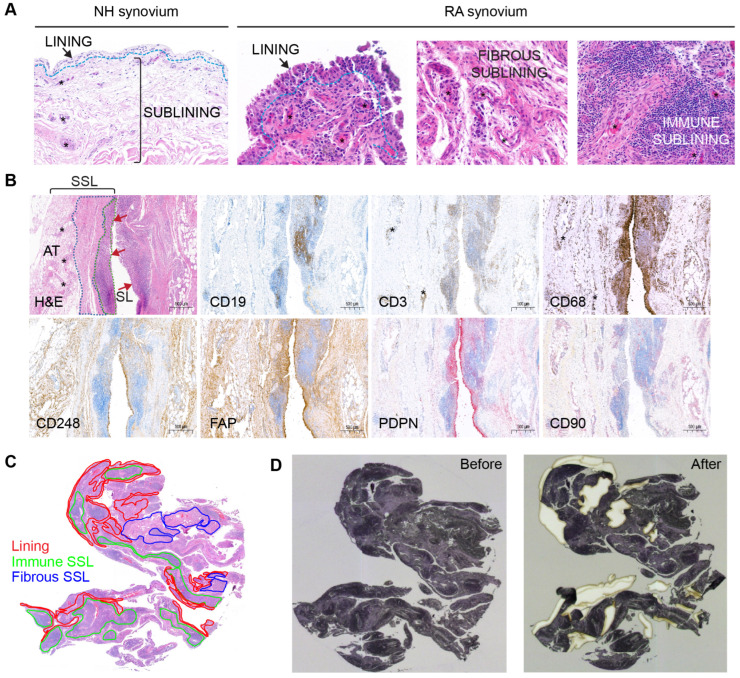
Understanding the heterogeneity of Rheumatoid Arthritis (RA) and identifying therapeutic targets remain challenging using traditional bulk transcriptomics alone, as it lacks the spatial and protein-level resolution needed to fully capture disease and tissue complexities. In this study, we applied Laser Capture Microdissection (LCM) coupled with mass spectrometry-based proteomics to analyze histopathological niches of the RA synovium, enabling the identification of protein expression profiles of the diseased synovial lining and sublining microenvironments compared to their healthy counterparts. In this respect, key pathogenetic RA proteins like membrane proteins (TYROBP, AOC3, SLC16A3, TCIRG1, and NCEH1), and extracellular matrix (ECM) proteins (PLOD2, OGN, and LUM) showed different expression patterns in diseased synovium compartments. To enhance our understanding of cellular dynamics within the dissected regions, we further integrated the proteomic dataset with single-cell RNA sequencing (scRNA-seq), and deduced cell type enrichment, including T cells, fibroblasts, NK cells, myeloid cells, B cells, and synovial endothelial cells. By combining high-resolution spatial proteomics and transcriptomic analyses, we provide novel insights into the molecular mechanisms driving RA, and highlight potential protein targets for therapeutic intervention. This integrative approach offers a more comprehensive view of RA synovial pathology, and mitigates the limitations of traditional bulk transcriptomics in target discovery.

Keywords: extracellular matrix; laser capture microdissection; mass spectrometry; membrane proteins; multi-omics integration; rheumatoid arthritis; scRNA-seq; untargeted proteomics.


Conflict of interest statement

All authors are employed by the AbbVie company. AbbVie funded the study and participated in study design, research, data collection, analysis and interpretation of data, writing, reviewing, and approving the publication. There are no additional conflicts of interest to report.

Figures

Figure 1
Figure 1
Synovial annotations and tissue dissection. (A) Microscopic compartments or microenvironments in NH and RA synovial samples including lining, fibrous sublining and immune sublining. (B) Immunohistochemical confirmation of a lymphoid-myeloid RA pathotype, with representation of synovial lining (SL, red arrows) and synovial sublining (SSL). Synovial histopathology based on H&E stain shows that the SSL is divided into immune-rich superficial areas (green dotted line) and fibrous-rich deeper areas (blue dotted line). Immune cell markers for CD19 (B cells), CD3 (T cells), and CD68 (macrophages) confirm that these cells are abundant in the immune-rich areas compared to fibrous rich-areas. By contrast, fibroblast markers like CD248 and FAP predominate outside immune-rich areas. The PDPN+ fibroblasts are preferentially distributed in the SL and superficial SSL surrounding the immune cell aggregates. The SL contains CD68+macrophages and CD248+ FAP+ PDPN+ and CD90 fibroblasts. The CD90+ fibroblasts are only detected in the SSL and predominantly oriented around blood vessels (asterisks). The deepest layer of the SSL is composed of adipose tissue (AT) rich in large blood vessels. (C) Pathologist various ROI annotations on the H&E synovium tissue section encompassing 2 mm2 from the SL, the immune SSL, and the fibrous SSL. (D) Transferring of ROIs to the hematoxylin-stained synovial section on the PEN-membrane slide and laser-capture microdissection of ROIs.
Figure 2
Figure 2
Proteomic profiling of different histopathological regions in NH and RA synovium. (A) Proteomics workflow coupling laser capture with LC-MS analysis. (BF) PCA plot showing discrimination among disease states and histopathological regions: (B) PCA clustering of all 5 region types. (C) PCA clustering of lining regions comparing NH versus RA. (D) PCA clustering of sublining regions comparing NH sublining, RA fibrous sublining and RA-immune sublining. (E) PCA clustering of NH regions comparing lining versus sublining. (F) PCA clustering of RA regions comparing RA lining, RA fibrous sublining, and RA-immune sublining. (G) Differential expression analysis between different histopathological regions. Horizontal dashed lines represent the adjusted p value or FDR of 0.05. Vertical dashed lines represent the fold change of 2 (Log2 FC of 1). (H) Differential expression analysis between disease conditions. Horizontal dashed lines represent the adjusted p value or FDR of 0.05. Vertical dashed lines represent the fold change of 2 (Log2 FC of 1). Some representative differential expressed proteins are labeled.
Figure 3
Figure 3
Membrane protein and matrisome protein profiling in different synovium regions. (AC) Gene Set Enrichment Analysis (GSEA) against Gene Oncology (GO) terms of Biological Process (BP) using pairwise protein expression comparisons (Log2 FC) among different histopathological regions identified enrichment of pathways related to membrane protein processing, signaling pathways and extracellular structure organization, especially in RA fibrous SSL (red highlight). (A) RA fibrous SSL versus RA SL. (B) RA fibrous SSL versus RA-immune SSL. (C) RA fibrous SSL versus NH SSL. (D,E) Clustered heatmaps of membrane and matrisome proteins that show differential expression between RA and NH groups (appear in both RA SL versus NH SL, and RA SSL versus NH fibrous SSL). (D) 57 up-regulated proteins and 3 down-regulated differentially expressed membrane proteins comparing RA versus NH groups. The whole protein expression matrices are normalized by protein rows and clustered based on correlation distance. (E) 18 up-regulated proteins and 6 down-regulated differentially expressed matrisome proteins comparing RA versus NH groups. The whole protein expression matrices are normalized by protein rows and clustered based on correlation distance. The sample group columns are not clustered.
Figure 4
Figure 4
Marker protein expression comparisons among region types. (A) TYROBP. (B) AOC3. (C) SLC16A3. (D) TCIRG1. (E) NCEH1. (F) PLOD2. (G) OGN. (H) LUM. We focus on all 10 pairwise comparisons from 5 groups. The numbers above the square brackets indicate p values < 0.05 from one-way ANOVA followed by Tukey’s multiple comparison tests.
Figure 5
Figure 5
Cell subcluster enrichments in different histopathological regions by the Query method integrating LCM spatial proteomics and scRNA-seq transcriptomics. For clarification, we only plot subclusters that display enrichment in at least one of five region types. All of the depleted subclusters are illustrated in Figure S5. (A) 8 T cell subclusters. (B) 10 stromal cell subclusters (fibroblast and mural cells). (C) 8 NK cell subclusters. (D) 14 myeloid cell subclusters. (E) 5 endothelial cell subclusters. (F) 2 B/plasma cell subclusters.
Figure 6
Figure 6
IHC comparison with spatial proteomics analysis. The protein expression of fibroblast markers like (A) CD90, (B) CD248, and (C) FAP with LCM proteomics were plotted. The numbers above the square brackets indicate p values < 0.05 from pairwise differential expression analyses. The immunohistochemical characterization of healthy (DG) and RA (HK) human synovium confirms that healthy fibroblasts are CD248+ CD90 and FAP. The scale bar is 50 µm. The expressions of CD90 (E,I), CD248 (F,J), and FAP (G,K) are increased in fibroblasts of the RA synovium, while SL fibroblasts remain CD90. The expression of CD90 is increased in RA, although the perivascular and vascular localization of CD90+ fibroblasts is maintained in health and disease (inset). H&E in (D,H); the insets in (EG,IK) show higher magnification (*). Synovial lining, fibrous sublining, and lymphoid aggregate in immune sublining, as labeled. The scale bar is 10 µm in insets.

Similar articles

References

    1. Zhang F., Jonsson A.H., Nathan A., Millard N., Curtis M., Xiao Q., Gutierrez-Arcelus M., Apruzzese W., Watts G.F.M., Weisenfeld D., et al. Deconstruction of rheumatoid arthritis synovium defines inflammatory subtypes. Nature. 2023;623:616–624. doi: 10.1038/s41586-023-06708-y. - DOI - PMC - PubMed
    1. Nakajima S., Tsuchiya H., Ota M., Ogawa M., Yamada S., Yoshida R., Maeda J., Shirai H., Kasai T., Hirose J., et al. Synovial Tissue Heterogeneity in Japanese Patients with Rheumatoid Arthritis Elucidated Using a Cell-Type Deconvolution Approach. Arthritis Rheumatol. 2023;75:2130–2136. doi: 10.1002/art.42642. - DOI - PubMed
    1. Velickovic M., Fillmore T.L., Attah I.K., Posso C., Pino J.C., Zhao R., Williams S.M., Velickovic D., Jacobs J.M., Burnum-Johnson K.E., et al. Coupling Microdroplet-Based Sample Preparation, Multiplexed Isobaric Labeling, and Nanoflow Peptide Fractionation for Deep Proteome Profiling of the Tissue Microenvironment. Anal. Chem. 2024;96:12973–12982. doi: 10.1021/acs.analchem.4c00523. - DOI - PMC - PubMed
    1. Mund A., Coscia F., Kriston A., Hollandi R., Kovacs F., Brunner A.D., Migh E., Schweizer L., Santos A., Bzorek M., et al. Deep Visual Proteomics defines single-cell identity and heterogeneity. Nat. Biotechnol. 2022;40:1231–1240. doi: 10.1038/s41587-022-01302-5. - DOI - PMC - PubMed
    1. Mao Y., Wang X., Huang P., Tian R. Spatial proteomics for understanding the tissue microenvironment. Analyst. 2021;146:3777–3798. doi: 10.1039/D1AN00472G. - DOI - PubMed

LinkOut - more resources