. 2025 Sep;12(35):e02926.
doi: 10.1002/advs.202502926. Epub 2025 Jun 25.

Adipocytes Promote Cisplatin Resistance through Secreting A1BG and Regulating NAMPT/PARP1 Axis-Mediated DNA Repair in Osteosarcoma

Affiliations

Adipocytes Promote Cisplatin Resistance through Secreting A1BG and Regulating NAMPT/PARP1 Axis-Mediated DNA Repair in Osteosarcoma

Yonghui Liang et al. Adv Sci (Weinh). 2025 Sep.

Abstract

Obesity is increasingly recognized as a negative prognostic factor for cancers, including osteosarcoma. However, the mechanisms linking obesity to chemoresistance in osteosarcoma remain unclear. This study found obesity is significantly associated with poor responses to cisplatin-based chemotherapy in osteosarcoma patients. In vitro, adipocyte-conditioned medium (Adi-CM) induced cisplatin resistance, while peritumoral adipocytes and diet-induced obesity (DIO) reduce the cisplatin efficacy in vivo. Mechanistically, Adi-CM enhanced DNA repair by the PARP1/ATM pathway activation. Proteomic analysis identified A1BG, a secreted protein upregulated in adipocytes from chemoresistant patients, as a key mediator of this effect. A1BG depletion in adipocytes restored cisplatin sensitivity, whereas recombinant A1BG enhanced resistance and promoted DNA repair. Further investigation revealed a direct interaction between A1BG and NAMPT, leading to the stabilization of NAMPT and an increased NAD+ production. This enhanced PARP1 activity and subsequent DNA repair. Importantly, pharmacological inhibition of NAMPT and PARP1 using FK886 and Olaparib, respectively, reversed Adi-CM-induced cisplatin resistance and restored cisplatin sensitivity in osteosarcoma cells, DIO mouse models, and patient-derived organoids. A novel link between obesity and cisplatin resistance in osteosarcoma is established, highlighting the A1BG/NAMPT/PARP1 axis as a critical driver. Targeting this axis may represent a promising therapeutic strategy for overcoming obesity-associated chemoresistance in osteosarcoma.

Keywords: adipocytes; cisplatin resistance; dna repair; osteosarcoma.


Conflict of interest statement

The authors declare no conflict of interest.

Figures

Figure 1
Figure 1
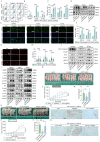
Adipocytes enhance Cisplatin Resistance in Osteosarcoma. A) Correlation analysis of tumor necrosis rate (%) with clinical variables in 100 patients with osteosarcoma. B) Correlation analysis between tumor necrosis rate (%) and BMI. C) Oil Red O staining of precursor adipocytes and mature adipocytes. D–G) CCK‐8 assay assessing osteosarcoma cell viability (MNNG, U2OS, K7M2) following treatment with cisplatin(6 µM), doxorubicin(400 nM), methotrexate(300 µM), or ifosfamide(300 µM) under control or Adi‐CM conditions (n = 3). H–J) Osteosarcoma cells (MNNG, U2OS, K7M2) were treated with cisplatin at varying concentrations for 48 h under control or Adi‐CM conditions, and the IC50 was calculated (n = 3). **p < 0.01; ***p < 0.001; ****p < 0.0001.
Figure 2
Figure 2
Adipocytes Promote Cisplatin Resistance in Osteosarcoma by Enhancing DNA Repair. A,B) Apoptosis assay of osteosarcoma cells (MNNG, U2OS, K7M2) treated with cisplatin under control or Adi‐CM conditions. C) The quantitative analysis of ROS levels (n = 3). D) Western blot analysis of P‐gp and CTR1 protein in osteosarcoma cells. E,F) Immunofluorescence analysis of γH2AX induction in osteosarcoma cells (MNNG, U2OS, K7M2) following cisplatin treatment under control or Adi‐CM conditions (n = 6). G,H) Comet assay of osteosarcoma cells (MNNG, U2OS, K7M2) treated with cisplatin under control or Adi‐CM conditions (n = 40). I) Western blot analysis of apoptosis and DNA damage markers in osteosarcoma cells (MNNG, U2OS, K7M2). J) Western blot analysis of PARP1/ATM pathway proteins in osteosarcoma cells. K) Xenograft tumors formed by MNNG cells mixed with or without adipocytes and treated with cisplatin (0.4 mg/kg) (n = 7). L,M) Volume and weight of xenograft tumors in (K) (n = 7). N) Xenograft tumors formed by K7M2 cells in lean or obese BALB/c mice and treated with cisplatin (0.4 mg kg−1) (n = 5). O,P) Volume and weight of xenograft tumors in (N) (n = 5). Q) γH2AX expression in xenograft tumor tissues from (K). R) γH2AX expression in xenograft tumor tissues from (N). The concentration of cisplatin in vitro was 6 µM. *p < 0.05; **p < 0.01; ***p < 0.001; ****p < 0.0001.
Figure 3
Figure 3
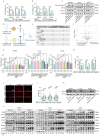
Adipocyte‐Derived A1BG Drives Cisplatin Resistance in Osteosarcoma via PARP1/ATM‐Mediated DNA Repair. A) CCK‐8 assay of osteosarcoma cells treated with cisplatin under control, Adi‐CM, or free fatty acid conditions (n = 3). B) CCK‐8 assay of osteosarcoma cells treated with cisplatin under control, Adi‐CM, or free‐secreted protein conditions (n = 3). C) Western blot analysis of apoptotic and DNA damage markers in osteosarcoma cells treated with cisplatin under control, Adi‐CM, or free‐secreted protein conditions. D) Schematic representation of supernatant collection and proteomic analysis. This figure was created in BioRender. Liang, Y. (2025) https://BioRender.com/e5hptvo. E) Clinical information of 12 patients from whom adipocytes were collected for proteomic analysis. F) Volcano plot depicting differentially expressed proteins identified in proteomic analysis. G) CCK‐8 assay of osteosarcoma cells treated with cisplatin in the presence or absence of Adi‐CM depleted of individual proteins, including APOH, CFH, VTN, SERPINA1, and A1BG (n = 3). H) CCK‐8 assay of osteosarcoma cells treated with cisplatin with or without recombinant A1BG protein (n = 3). I,J) Comet assay of osteosarcoma cells treated with cisplatin with or without recombinant A1BG protein (n = 40). K) γH2AX expression in osteosarcoma cells treated with cisplatin with or without recombinant A1BG protein. L) Western blot analysis of A1BG, PARP1, ATM, and p‐ATM expression at 0, 6, 12, and 24 h following cisplatin treatment in osteosarcoma cells under A1BG‐depleted or recombinant A1BG‐supplemented conditions. The concentration of cisplatin in vitro was 6 µM. *p < 0.05; **p < 0.01; ***p < 0.001; ****p < 0.0001.
Figure 4
Figure 4
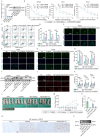
Targeting Adipocyte‐Derived A1BG Overcomes Cisplatin Resistance in Osteosarcoma. A) The qPCR and WB were used to detect the knock down efficiency of A1BG shRNA in 3T3‐L1 cells. B) Osteosarcoma cells (MNNG, U2OS, K7M2) were treated with cisplatin at varying concentrations for 48 h under control, Adi‐CM, and A1BG‐depleted Adi‐CM conditions, and the IC50 was calculated (n = 3). C,D) Apoptosis assay of osteosarcoma cells treated with cisplatin under control, Adi‐CM, and A1BG‐depleted Adi‐CM conditions (n = 3). E–H) Immunofluorescence analysis of γH2AX in osteosarcoma cells under the conditions described in (C) (n = 6). I) Western blot analysis of γH2AX in osteosarcoma cells under the conditions described in (C). J,K) Comet assay of osteosarcoma cells under the conditions described in (C) (n = 40). L) Xenograft tumors formed by MNNG cells mixed with or without adipocytes and A1BG‐depleted adipocytes, followed by cisplatin treatment (0.4 mg kg−1) (n = 4). M,N) Volume and weight of xenograft tumors from (L) (n = 4). O,P) γH2AX expression in xenograft tumor tissues from (L), analyzed via immunohistochemistry (IHC) and western blot. The concentration of cisplatin in vitro was 6 µM. *p < 0.05; **p < 0.01; ***p < 0.001; ****p < 0.0001.
Figure 5
Figure 5
A1BG Interacts with and Stabilizes NAMPT in Osteosarcoma Cells. A) Co‐immunoprecipitation (Co‐IP) assay to determine protein interactions with A1BG. Immunoprecipitated isolated using an anti‐HA antibody were subjected to sodium dodecyl sulfate‐polyacrylamide gel electrophoresis (SDS‐PAGE) followed by silver staining. B) Distribution of protein numbers identified in mass spectrometry (MS) analysis in MNNG‐A1BG, MNNG‐IgG, U2OS‐A1BG, U2OS‐IgG, K7M2‐A1BG, and K7M2‐IgG groups. C) Number of potential A1BG‐interacting proteins identified in MNNG, U2OS, and K7M2 cells. D) Co‐IP using an anti‐HA antibody (upper panel) or anti‐NAMPT antibody (lower panel), followed by immunoblotting with anti‐A1BG and anti‐NAMPT antibodies. IgG served as a negative control. E) Immunofluorescence analysis confirming A1BG and NAMPT colocalization. A1BG was labeled in red, NAMPT in green, and the nucleus in blue. F) A1BG and NAMPT expression levels in osteosarcoma cells treated with cisplatin under control, Adi‐CM, and A1BG‐depleted Adi‐CM conditions. G) NAMPT mRNA levels following A1BG knockdown, showing no significant change. H) NAMPT protein levels following A1BG knockdown, showing a significant decrease. I) Osteosarcoma cells (MNNG, U2OS, K7M2) with or without A1BG knockdown were treated with cycloheximide (50 µg mL−1) for 0, 6, 12, and 18 h. Cell lysates were analyzed by western blot. J) The expression of NAMPT with A1BG knockdown or not under the DMSO, MG132 and Chloroquine treatment in MNNG, U2OS and K7M2 cells. **p < 0.01; ***p < 0.001; ****p < 0.0001.
Figure 6
Figure 6
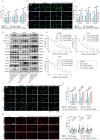
A1BG‐Activated NAMPT Enhances NAD+ Levels and Promotes PARP1‐Mediated ADP‐Ribosylation and DNA Repair. A) NAD⁺ levels in osteosarcoma cells treated with cisplatin under control, Adi‐CM, and A1BG‐depleted Adi‐CM conditions (n = 3). B,C) Immunofluorescence analysis of ADP levels in osteosarcoma cells treated with cisplatin under control, Adi‐CM, and A1BG‐depleted Adi‐CM conditions (n = 6). D) Western blot analysis of PARP1/ATM pathway proteins in osteosarcoma cells. E) IC50 values of cisplatin in osteosarcoma cells treated with or without Adi‐CM, FK886 (5 nM), and Olaparib (10 µM) (n = 3). F,G) Immunofluorescence analysis of γH2AX in osteosarcoma cells under the conditions described in (E) (n = 6). H,I) Comet assay of osteosarcoma cells under the conditions described in (E) (n = 40). The concentration of drug in vitro: cisplatin = 6 µM; FK886 = 5 nM; Olaparib = 10 µM. *p < 0.05; **p < 0.01; ***p < 0.001; ****p < 0.0001.
Figure 7
Figure 7
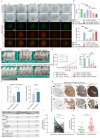
Targeting NAMPT and PARP1 Reduces Cisplatin Resistance Induced by Adipocytes in Osteosarcoma. A) Assessment of cisplatin resistance induced by Adi‐CM and A1BG, and evaluation of the therapeutic efficacy of FK886 and Olaparib in an osteosarcoma organoid model (n = 3). B) Cell viability analysis in the osteosarcoma organoid model using live/dead staining. C) Quantification of organoid inhibition rate from (A). D) Evaluation of cisplatin treatment in combination with FK886 and Olaparib in a xenograft tumor model using obese mice (n = 4). E,F) Tumor volume and weight measurements from xenograft tumors in (D). G) ELISA analysis of A1BG levels in peritumoral adipocyte supernatants and serum samples (n = 6). H) Tissue microarray (TMA) analysis of NAMPT expression in osteosarcoma tissues, with a representative IHC‐stained image. I) Correlation analysis between NAMPT expression levels and clinical variables in 100 patients with osteosarcoma. J) Immunohistochemistry (IHC) analysis quantifying NAMPT expression in osteosarcoma tissues and matched adjacent normal tissues. K) IHC analysis comparing NAMPT expression levels in chemoresistant and chemosensitive osteosarcoma tumors. The concentration of drug in vitro: cisplatin = 6 µM; FK886 = 5 nM; Olaparib = 10 µM. *p < 0.05; **p < 0.01; ***p < 0.001; ****p < 0.0001.

References

    1. a) Xu Y., Shi F., Zhang Y., Yin M., Han X., Feng J., Wang G., Int. J. Cancer 2024, 154, 226; - PubMed
    2. b) Beird H. C., Bielack S. S., Flanagan A. M., Gill J., Heymann D., Janeway K. A., Livingston J. A., Roberts R. D., Strauss S. J., Gorlick R., Nat. Rev. Dis. Primers 2022, 8, 77. - PubMed
    1. a) Anwar M. A., El‐Baba C., Elnaggar M. H., Elkholy Y. O., Mottawea M., Johar D., Al Shehabi T. S., Kobeissy F., Moussalem C., Massaad E., Omeis I., Darwiche N., Eid A. H., Semin. Cancer Biol. 2020, 64, 83; - PubMed
    2. b) Tsuda Y., Tsoi K., Parry M. C., Stevenson J. D., Fujiwara T., Sumathi V., Jeys L. M., Bone Joint J. 2020, 102‐b, 795. - PubMed
    1. a) Davis A. M., Bell R. S., Goodwin P. J., J. Clin. Oncol. 1994, 12, 423; - PubMed
    2. b) Rosen G., Marcove R. C., Huvos A. G., Caparros B. I., Lane J. M., Nirenberg A., Cacavio A., Groshen S., J. Cancer Res. Clin. Oncol. 1983, 106, 55. - PMC - PubMed
    1. a) Altaf S., Enders F., Jeavons E., Krailo M., Barkauskas D. A., Meyers P., Arndt C., Pediatr. Blood Cancer 2013, 60, 2042; - PubMed
    2. b) Maimaitiyiming M., Yang H., Zhou L., Zhang X., Cai Q., Wang Y., BMC Med. 2023, 21, 251; - PMC - PubMed
    3. c) Seke Etet P. F., Vecchio L., Nwabo Kamdje A. H., Mimche P. N., Njamnshi A. K., Adem A., Semin. Cancer Biol. 2023, 94, 50; - PubMed
    4. d) Hardaway A. L., Herroon M. K., Rajagurubandara E., Podgorski I., Cancer Metastasis Rev. 2014, 33, 527; - PMC - PubMed
    5. e) Neuhouser M. L., Aragaki A. K., Prentice R. L., Manson J. E., Chlebowski R., Carty C. L., Ochs‐Balcom H. M., Thomson C. A., Caan B. J., Tinker L. F., Urrutia R. P., Knudtson J., Anderson G. L., JAMA Oncol 2015, 1, 611; - PMC - PubMed
    6. f) Zhou X., Zhang J., Lv W., Zhao C., Xia Y., Wu Y., Zhang Q., J. Exp. Clin. Cancer Res. 2022, 41, 203. - PMC - PubMed
    1. a) Hanley M. J., Abernethy D. R., Greenblatt D. J., Clin. Pharmacokinet. 2010, 49, 71; - PubMed
    2. b) Cao Y., J. Clin. Invest. 2019, 129, 3006. - PMC - PubMed

MeSH terms

LinkOut - more resources