Comment
. 2025 Aug 1;160(8):884-892.
doi: 10.1001/jamasurg.2025.1999.

Artificial Intelligence-Powered Spatial Analysis of Immune Phenotypes in Resected Pancreatic Cancer

Affiliations
Comment

Artificial Intelligence-Powered Spatial Analysis of Immune Phenotypes in Resected Pancreatic Cancer

Hyemin Kim et al. JAMA Surg. .

Abstract

Importance: Although tumor-infiltrating lymphocytes (TILs) have been implicated as prognostic biomarkers across various malignancies, the clinical application remains challenging. This study evaluated the applicability of artificial intelligence (AI)-powered spatial mapping of TIL density for prognostic assessment in resected pancreatic ductal adenocarcinoma (PDAC).

Objective: To evaluate the prognostic significance of AI-powered spatial TIL analysis in resected PDAC and its clinical applicability.

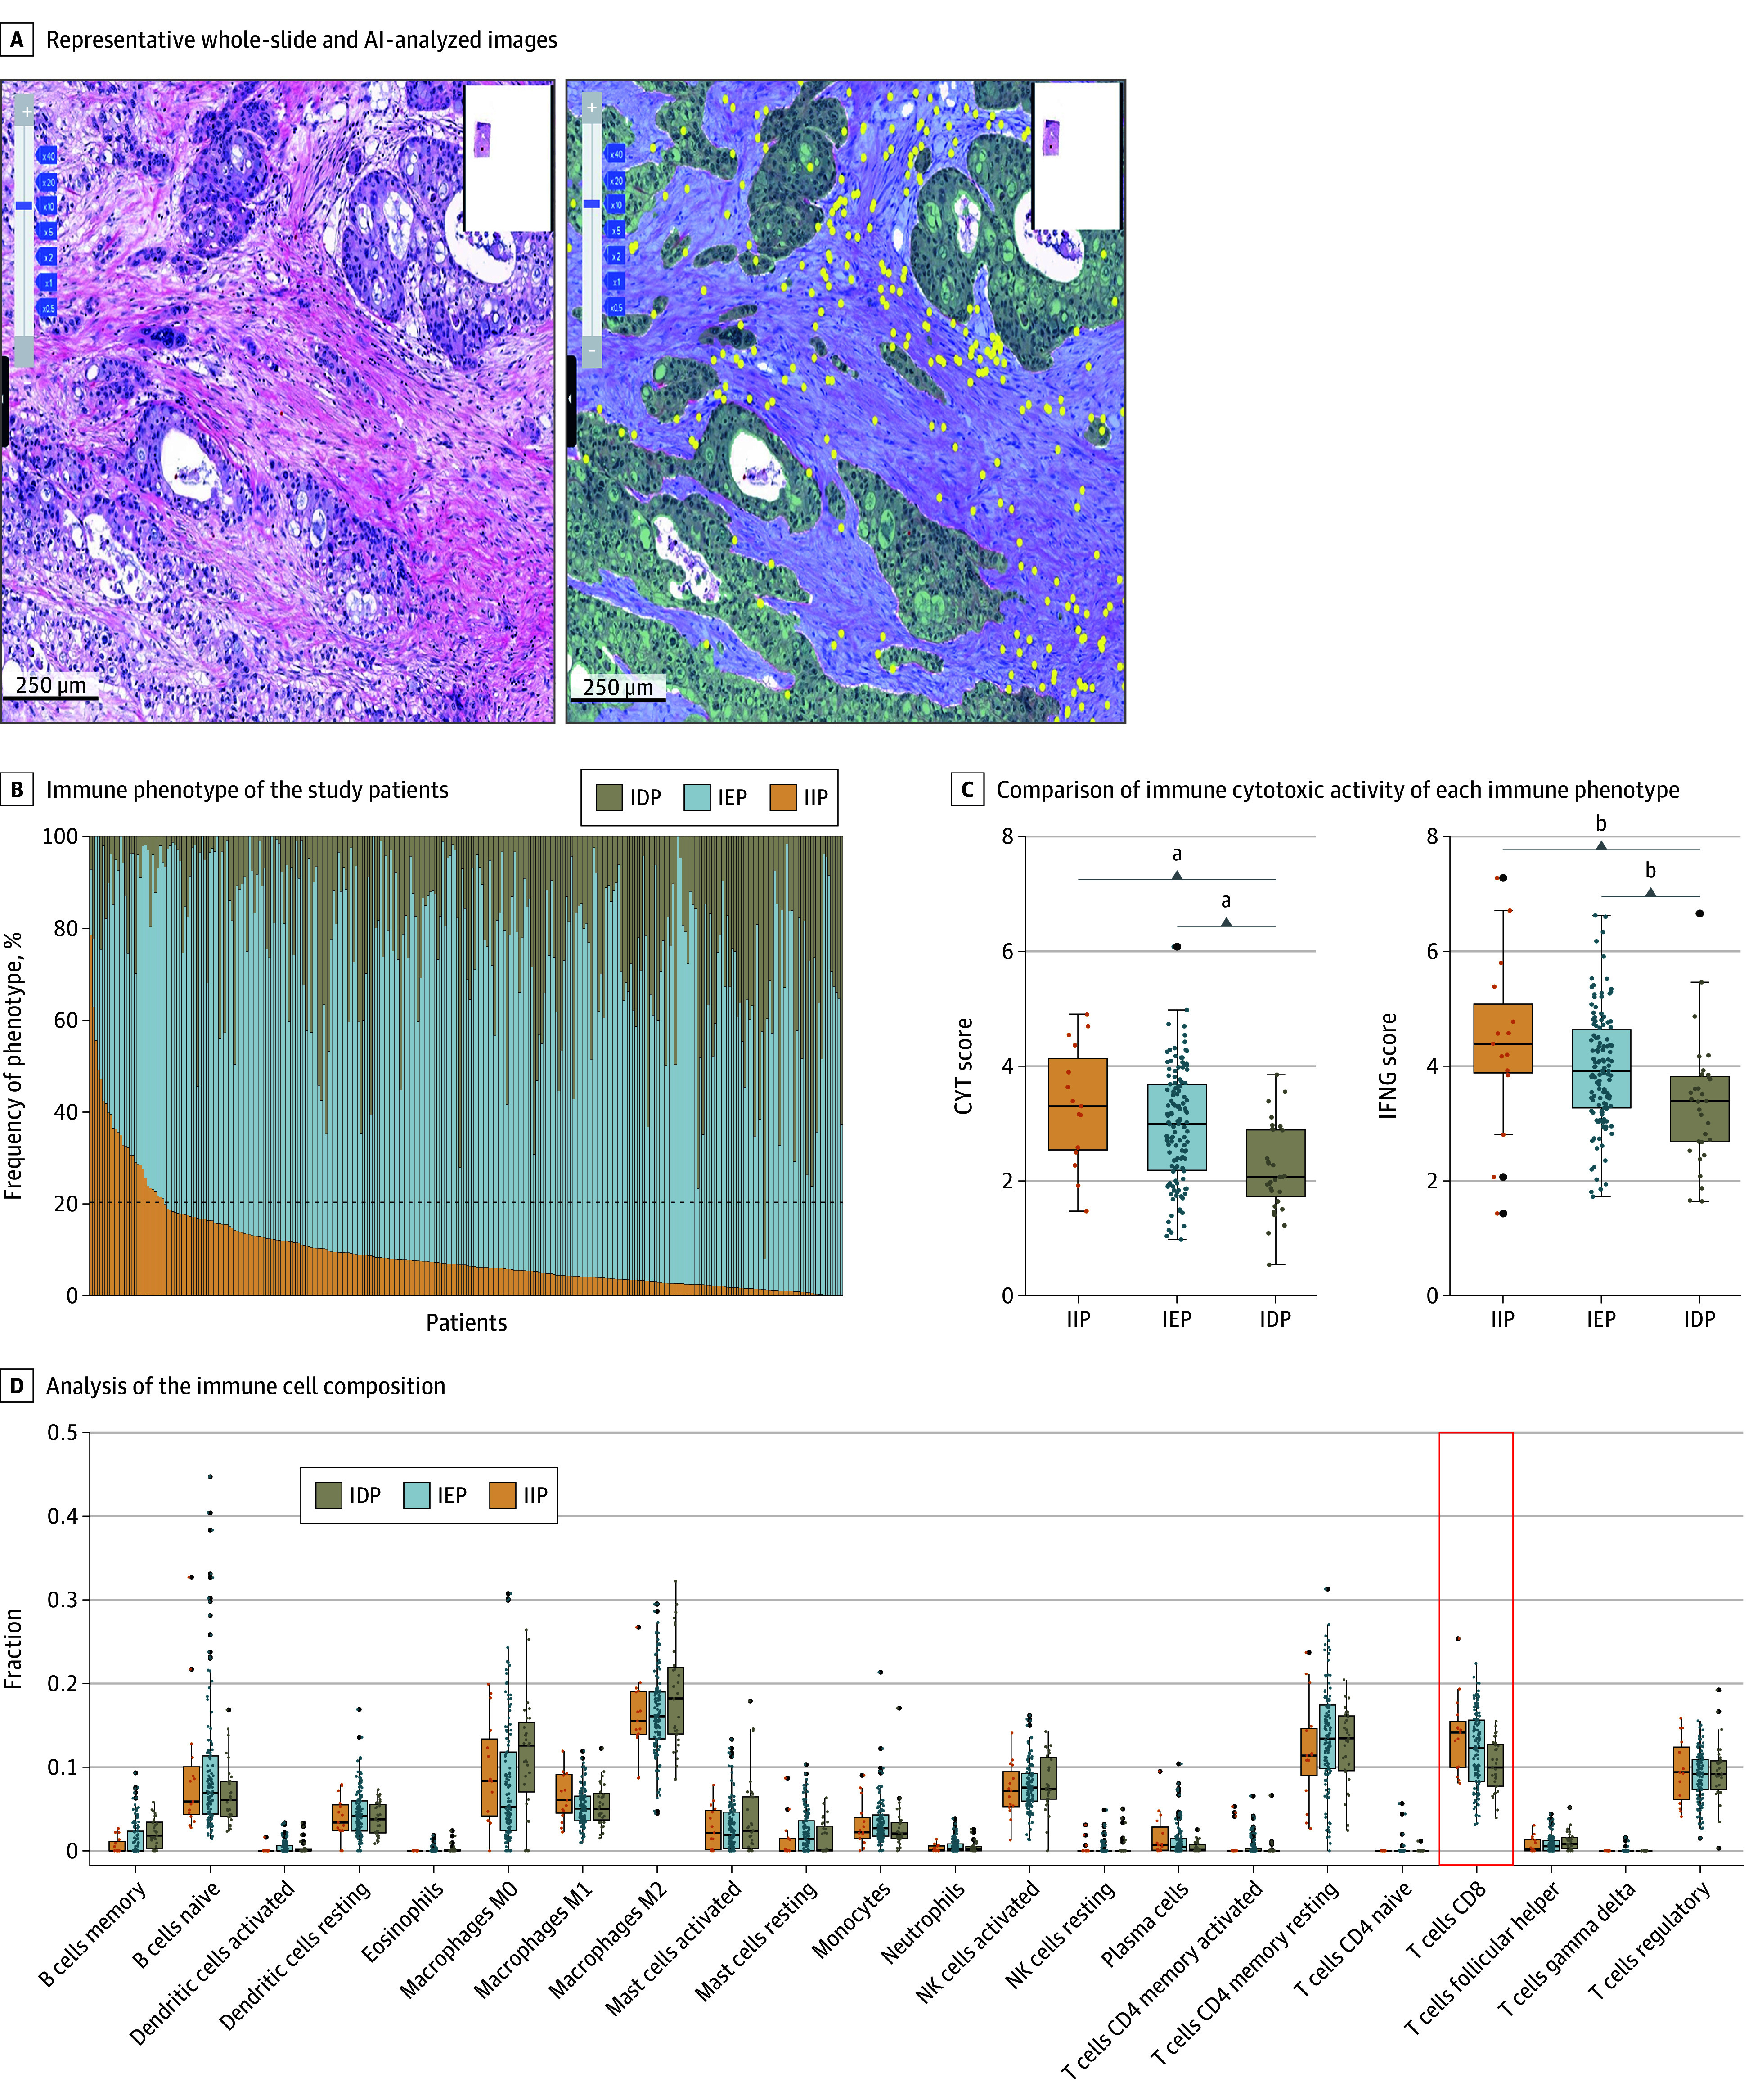
Design, setting, and participants: This cohort study included patients with PDAC who underwent up-front R0 resection at a tertiary referral center between January 2017 and December 2020. Whole-slide images of retrospectively enrolled patients with PDAC and up-front R0 resection were analyzed. An AI-powered whole-slide image analyzer was used for spatial TIL quantification, segmentation of tumor and stroma, and immune phenotype classification as immune-inflamed phenotype, immune-excluded phenotype, or immune-desert phenotype. Study data were analyzed from January 2017 to August 2023.

Exposure: Use of AI-powered spatial analysis of the tumor microenvironment in resected PDACs.

Main outcomes and measures: Tumor microenvironment-related risk factors and their associations with overall survival (OS) and recurrence-free survival (RFS) outcomes were identified.

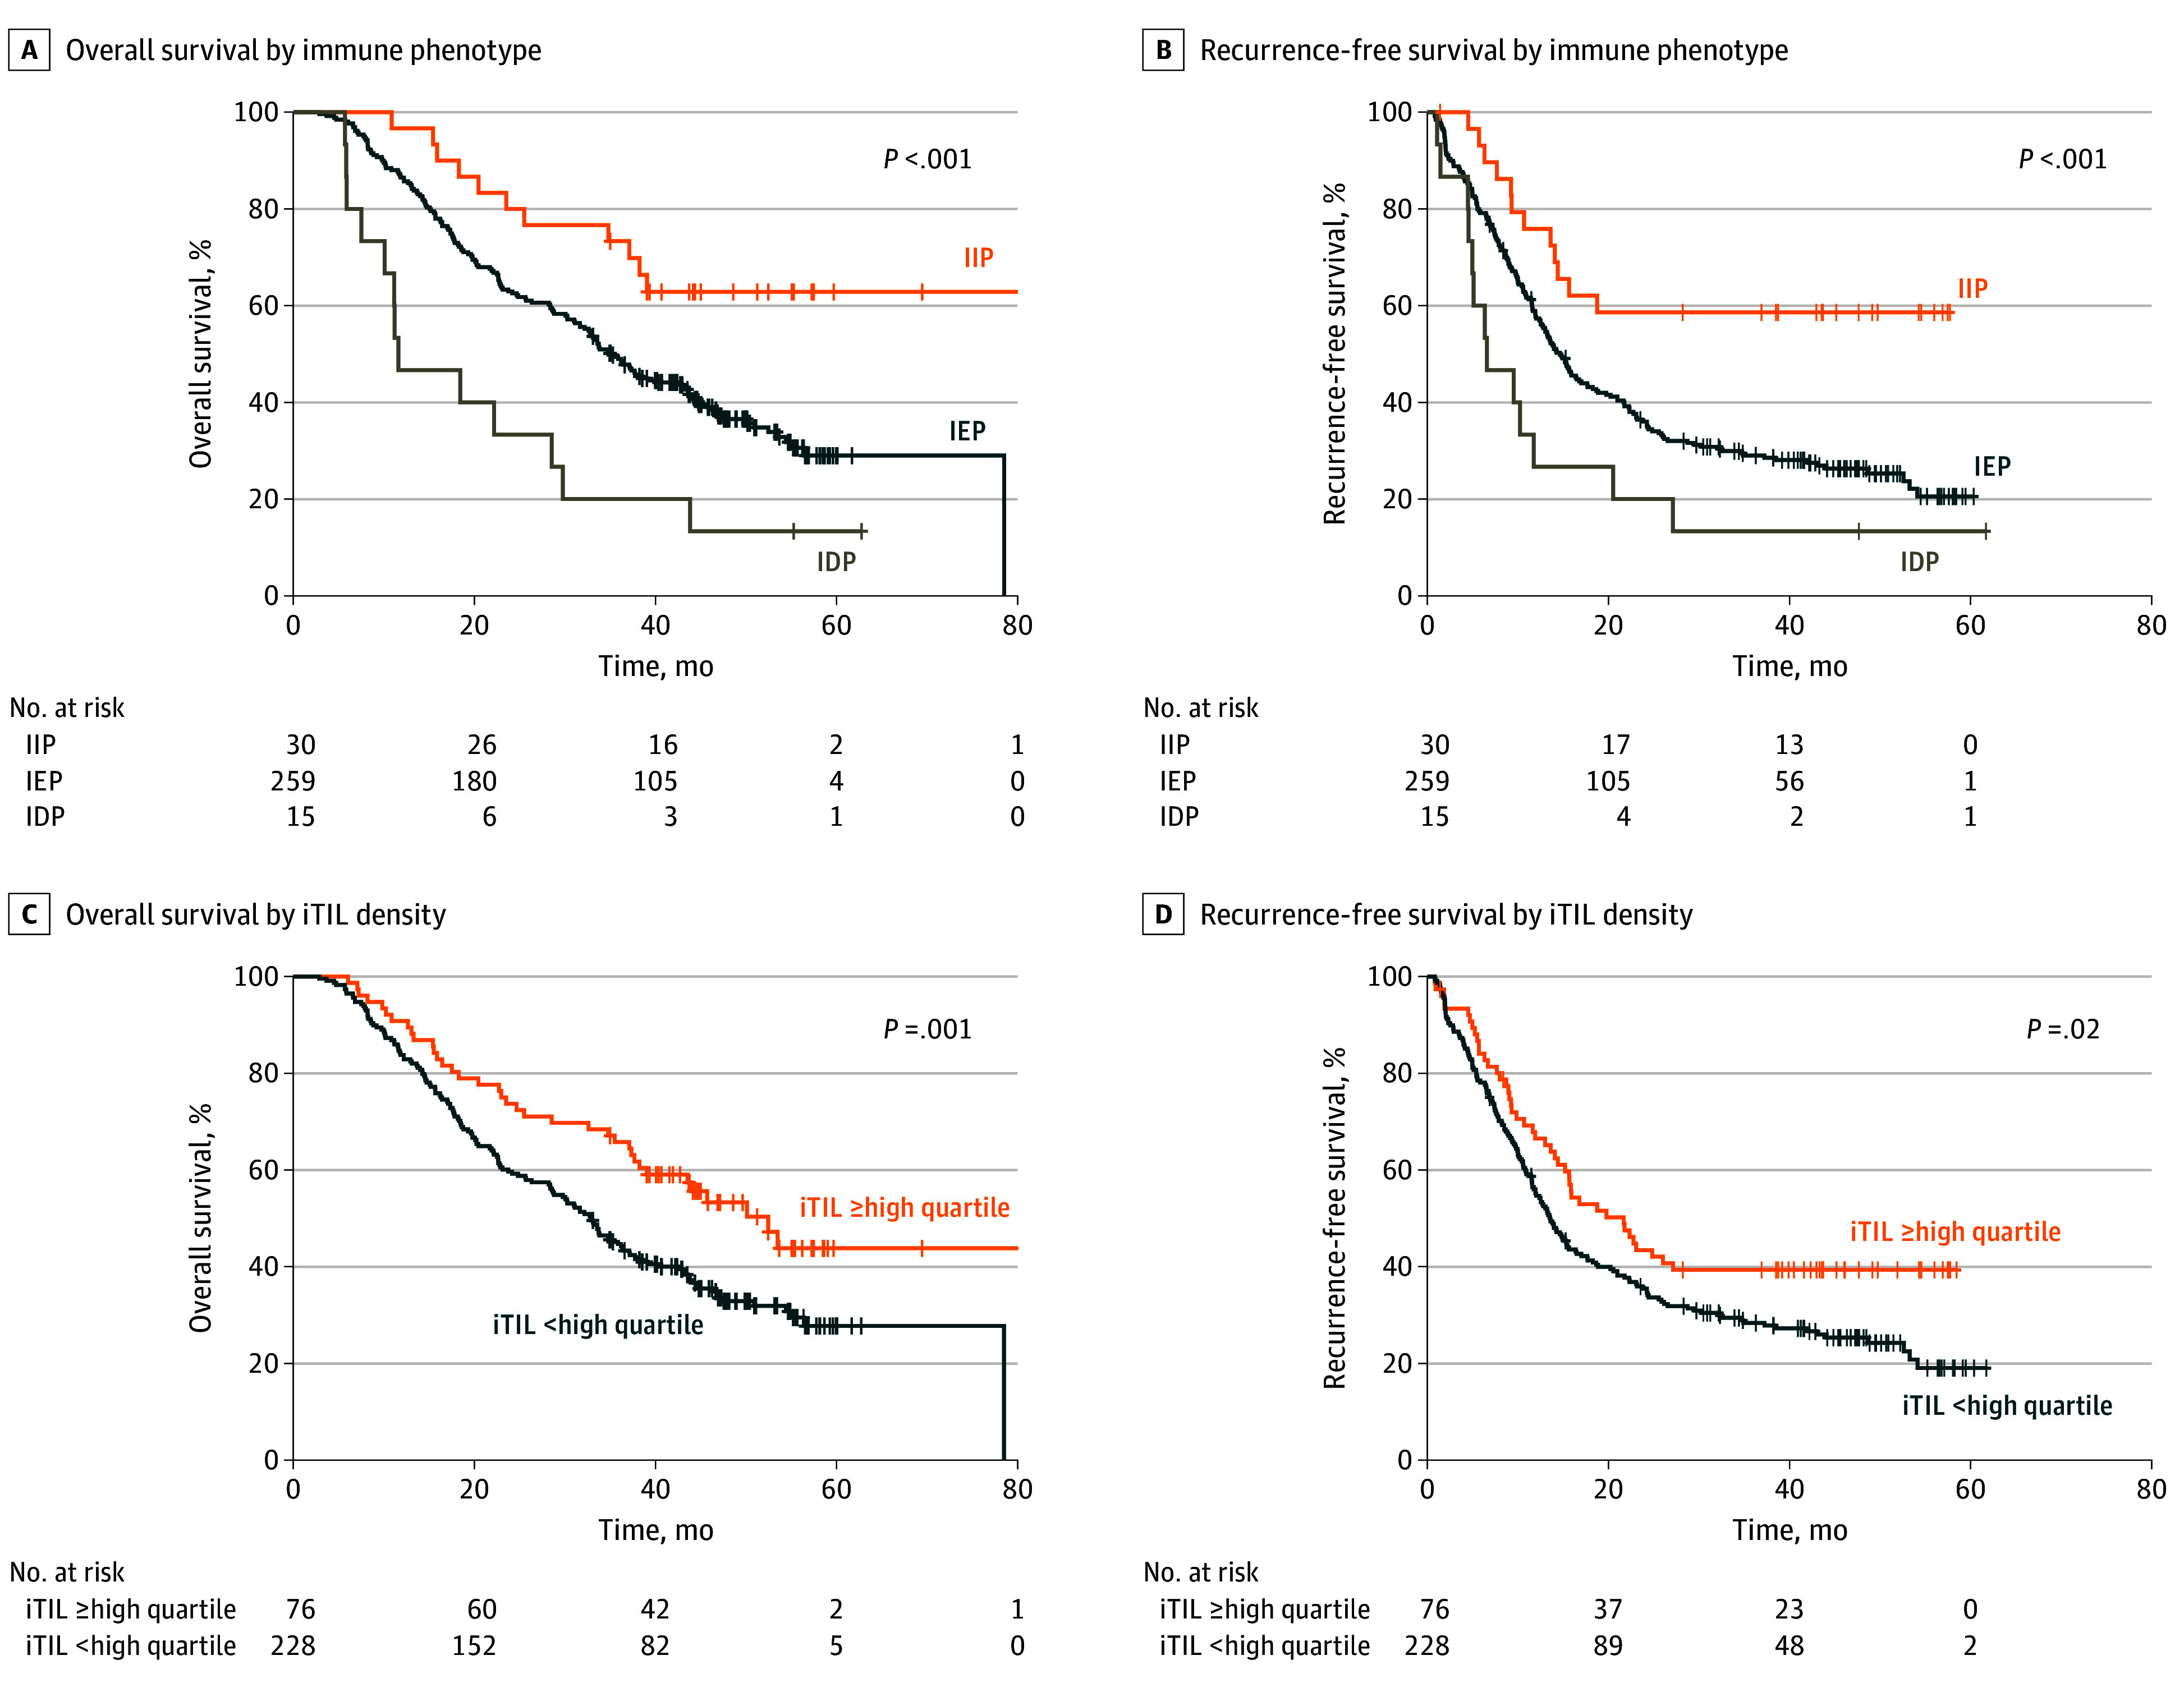
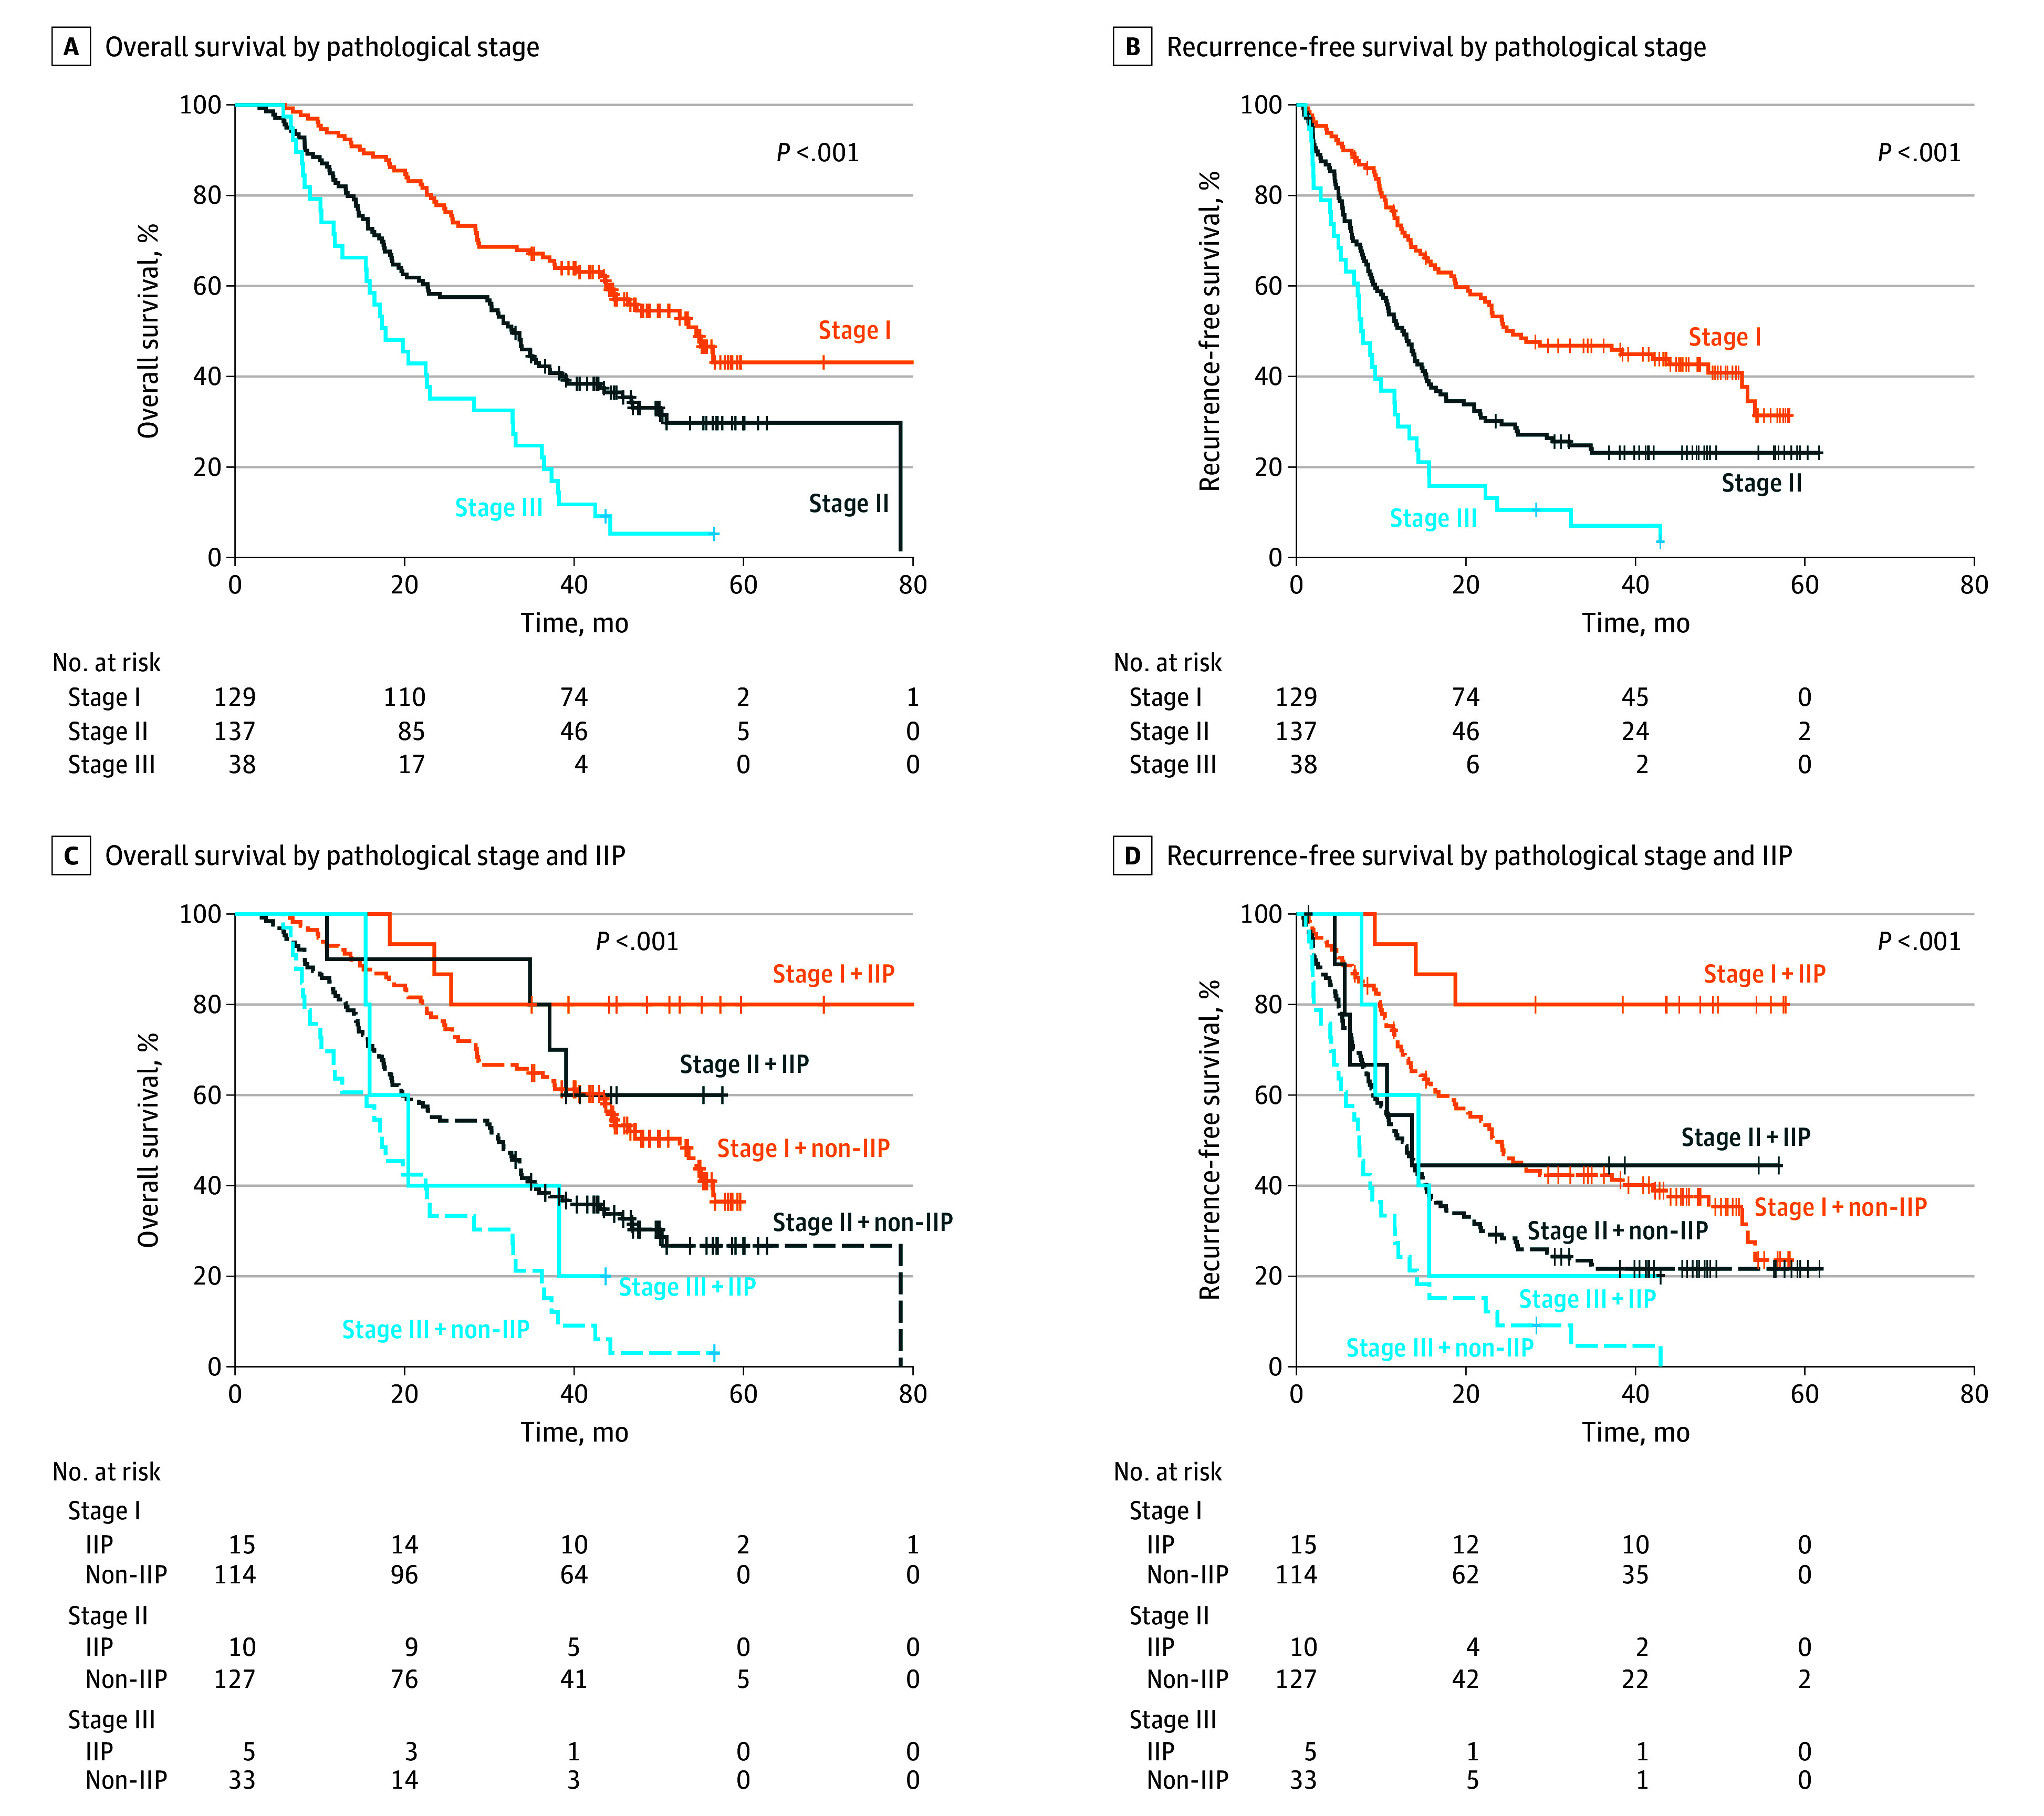
Results: Among 304 patients, the mean (SD) age was 66.8 (9.4) years with 171 male patients (56.3%), and preoperative clinical stages I and II were represented by 54.3% patients (165 of 304) and 45.7% patients (139 of 304), respectively. The TILs in the tumor microenvironment were predominantly concentrated in the stroma, and the median intratumoral TIL and stromal TIL densities were 100.64/mm2 (IQR, 53.25-121.39/mm2) and 734.88/mm2 (IQR, 443.10-911.16/mm2), respectively. Overall, 9.9% of tumors (30 of 304) were immune inflamed, 85.2% (259 of 304) were immune excluded, and 4.9% (15 of 304) were immune desert. The immune-inflamed phenotype was associated with the most prolonged OS (median not reached; P < .001) and RFS (median not reached; P = .001), followed by immune-excluded phenotype and immune-desert phenotype. High intratumoral TIL density was associated with longer OS (median, 52.47 months; 95% CI, 41.98-62.96; P = .004) and RFS (median, 21.67 months; 95% CI, 14.43-28.91; P = .02). A combined analysis of the pathologic stage with immune phenotype predicted better survival of stage II PDAC stratified as immune-inflamed phenotype than stage I PDAC stratified as non-immune-inflamed phenotype.

Conclusions and relevance: Results of this cohort study suggest that the use of AI has markedly condensed the labor-intensive process of TIL assessment, potentially rendering the process more feasible and practical in clinical application. Importantly, the IP may be one of the most important prognostic biomarkers in resected PDACs.


Conflict of interest statement

Conflict of Interest Disclosures: Drs Ock, H. Song, Moon, Lim, S. Song, Pereira, and Seungeun Lee reported being employees of Lunit outside the submitted work. No other disclosures were reported.

Figures

Figure 1.
Figure 1.. Distribution of Immune Phenotypes and Composition of Tumor-Infiltrating Lymphocytes
A, Representative image of the original hematoxylin-eosin–stained whole-slide image (left) and Lunit SCOPE IO-inferenced image (right, tumor area, green; stroma area, blue; lymphocytes, yellow). B, Landscape of the immune phenotype of the study patients. C, CIBERSORTx (Stanford University), a machine learning method to infer cell type–specific gene expression profiles without physical cell isolation, analysis of the immune cell composition using The Cancer Genome Atlas (TCGA) Pancreatic Adenocarcinoma (PAAD) database. D, Comparison of the immune cytotoxic activity of each immune phenotype by cytolytic activity (CYT) score (left) and interferon-γ (IFNG) score (right) using the TCGA-PAAD database. Whiskers extend from the box to the minimum and maximum values within 1.5 × IQR from Q1 and Q3. Any point that falls outside the whiskers is considered an outlier. IDP indicates immune-desert phenotype; IEP, immune-excluded phenotype; IIP, immune-inflamed phenotype.
Figure 2.
Figure 2.. Kaplan-Meier Analysis for the Comparison of Survival Outcomes in the Study Patients
A, Overall survival according to immune phenotype. The hazard ratio (HR) for immune-excluded phenotype (IEP) was 2.28 (95% CI, 1.23-4.21), and for immune-desert phenotype (IDP), HR was 5.20 (95% CI, 2.23-11.65). B, Recurrence-free survival according to the immune phenotype. For IEP, the HR was 2.42 (95% CI, 1.35-4.34), and for IDP, HR was 4.18 (95% CI, 1.91-9.19). C, Overall survival according to the intratumoral tumor-infiltrating lymphocyte (iTIL) density. The HR was 0.59 (95% CI, 0.41-0.85). D, Recurrence-free survival according to the iTIL density. The HR was 0.68 (95% CI, 0.49-0.94). IIP indicates immune-inflamed phenotype.
Figure 3.
Figure 3.. Survival Outcome Prediction According to Tumor Stage and Immune Phenotype
A, Overall survival according to pathological stage. B, Recurrence-free survival according to the pathological stage. C, Overall survival and recurrence-free survival (D) according to pathologic stage stratified by immune-inflamed phenotype (IIP) or non-IIP (immune-excluded phenotype + immune-desert phenotype).

Comment on

  • The Future of Oncology Is Now.
    Ahmad SA, Wilson GC, Patel SH. Ahmad SA, et al. JAMA Surg. 2025 Aug 1;160(8):893. doi: 10.1001/jamasurg.2025.1978. JAMA Surg. 2025. PMID: 40560593 No abstract available.

Similar articles

References

    1. Grossberg AJ, Chu LC, Deig CR, et al. Multidisciplinary standards of care and recent progress in pancreatic ductal adenocarcinoma. CA Cancer J Clin. 2020;70(5):375-403. doi: 10.3322/caac.21626 - DOI - PMC - PubMed
    1. Provenzano PP, Cuevas C, Chang AE, Goel VK, Von Hoff DD, Hingorani SR. Enzymatic targeting of the stroma ablates physical barriers to treatment of pancreatic ductal adenocarcinoma. Cancer Cell. 2012;21(3):418-429. doi: 10.1016/j.ccr.2012.01.007 - DOI - PMC - PubMed
    1. Ho WJ, Jaffee EM, Zheng L. The tumor microenvironment in pancreatic cancer—clinical challenges and opportunities. Nat Rev Clin Oncol. 2020;17(9):527-540. doi: 10.1038/s41571-020-0363-5 - DOI - PMC - PubMed
    1. Whatcott CJ, Diep CH, Jiang P, et al. Desmoplasia in primary tumors and metastatic lesions of pancreatic cancer. Clin Cancer Res. 2015;21(15):3561-3568. doi: 10.1158/1078-0432.CCR-14-1051 - DOI - PMC - PubMed
    1. Orhan A, Vogelsang RP, Andersen MB, et al. The prognostic value of tumor-infiltrating lymphocytes in pancreatic cancer: a systematic review and meta-analysis. Eur J Cancer. 2020;132:71-84. doi: 10.1016/j.ejca.2020.03.013 - DOI - PubMed