. 2025 Jul;122(26):e2508297122.
doi: 10.1073/pnas.2508297122. Epub 2025 Jun 25.

Trichomonas vaginalis extracellular vesicles suppress IFNε-mediated responses driven by its intracellular bacterial symbiont Mycoplasma hominis

Affiliations

Trichomonas vaginalis extracellular vesicles suppress IFNε-mediated responses driven by its intracellular bacterial symbiont Mycoplasma hominis

Joshua A Kochanowsky et al. Proc Natl Acad Sci U S A. 2025 Jul.

Abstract

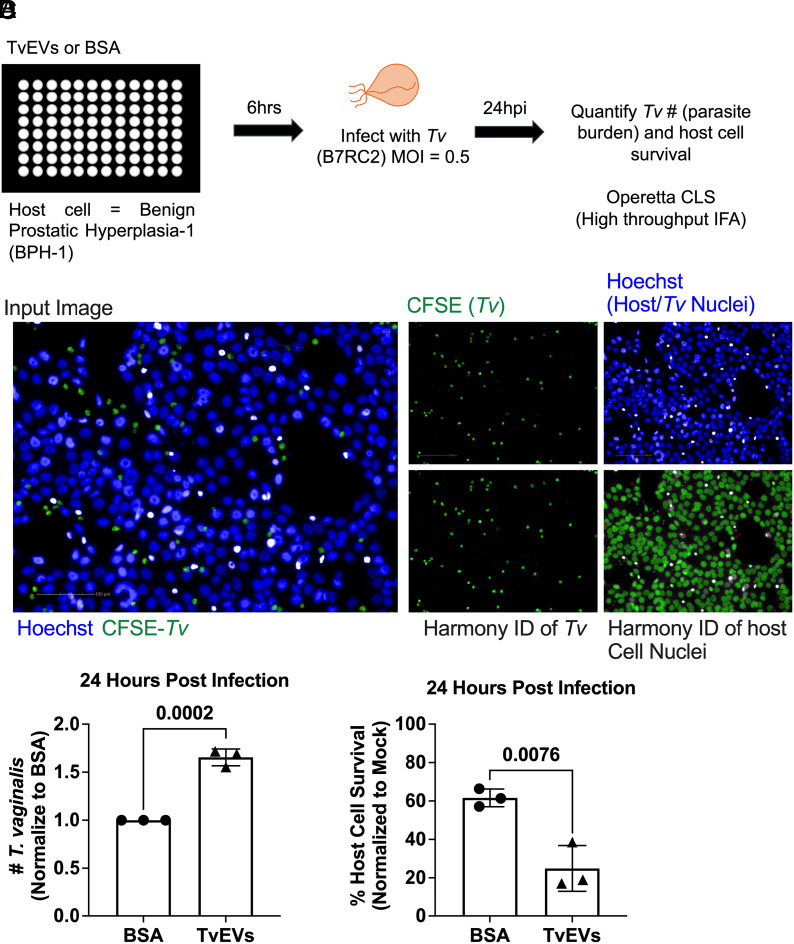
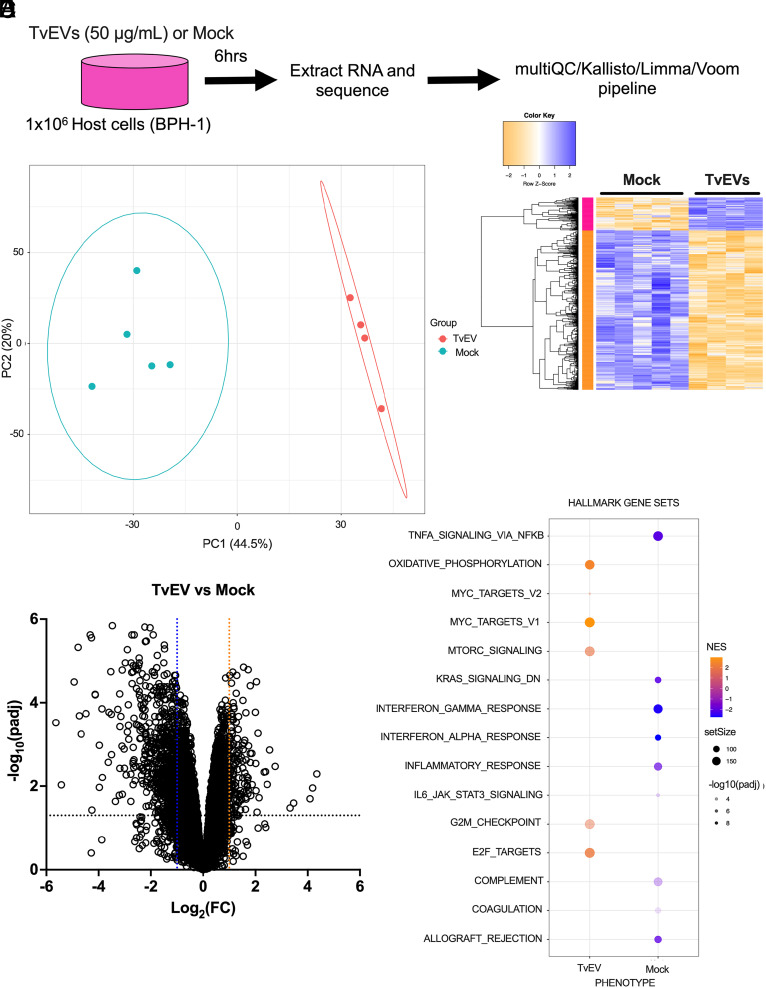
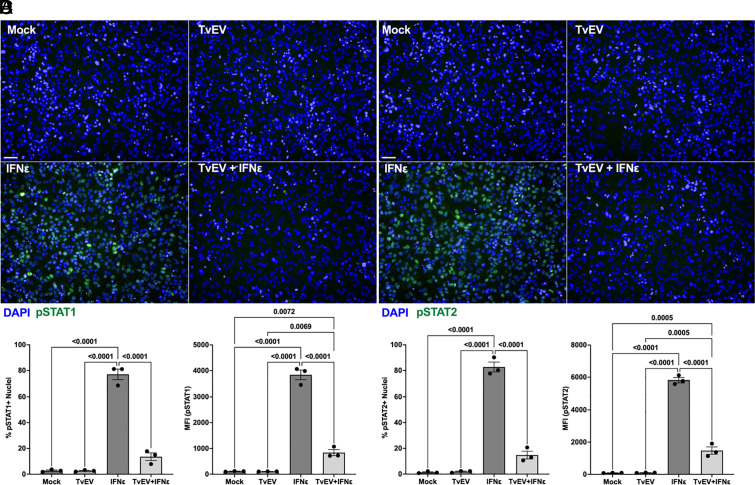
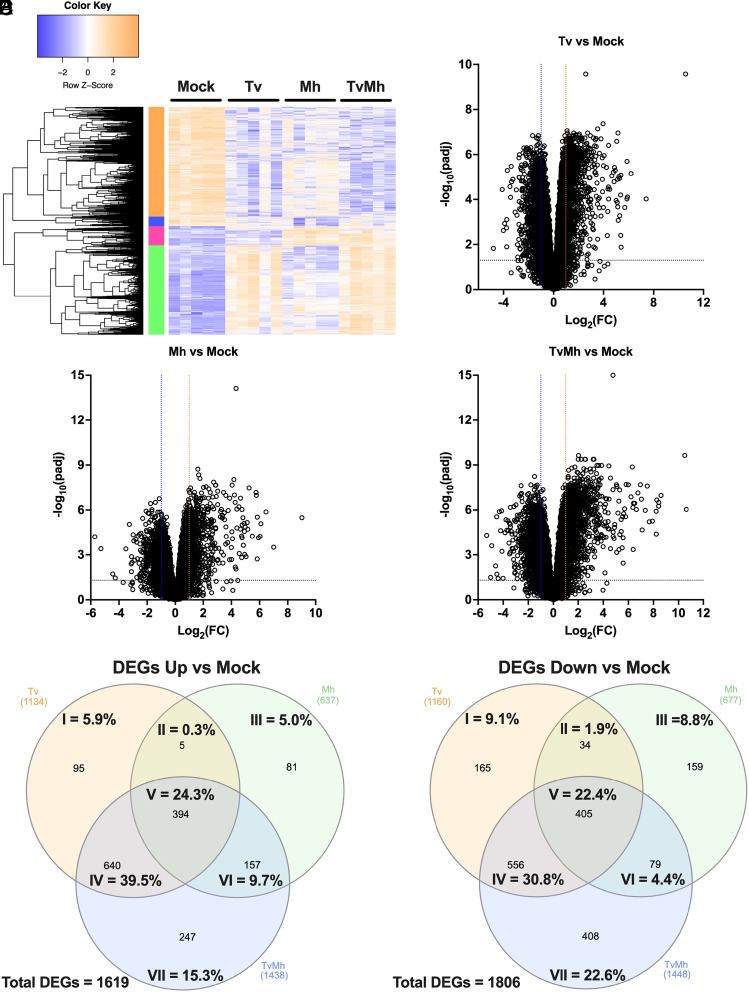
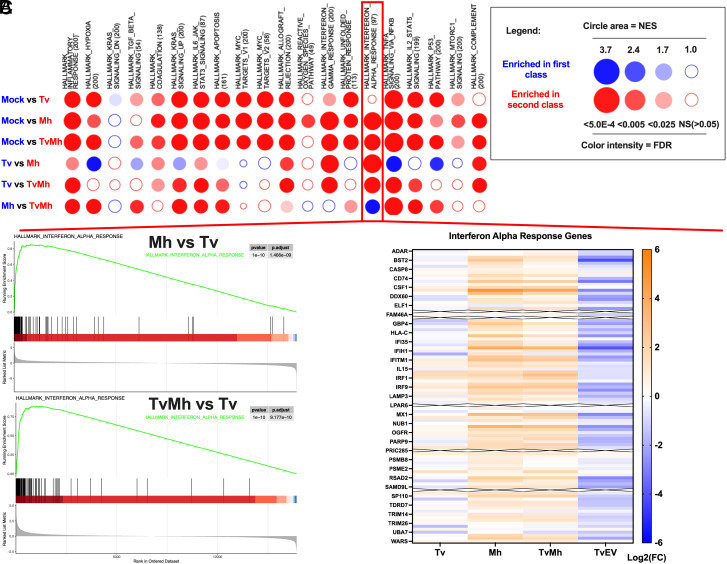
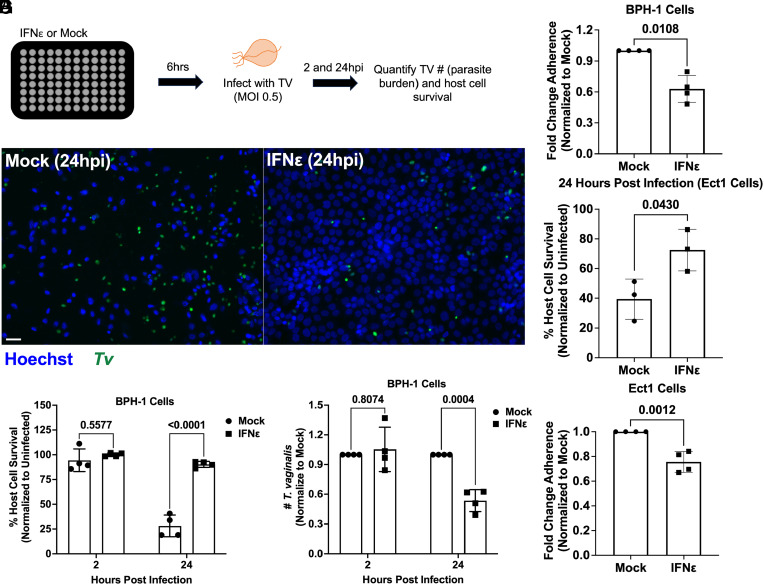
Trichomonas vaginalis is a common, extracellular, sexually transmitted parasite which is often found in symbiosis with the intracellular bacterium Mycoplasma hominis (Mh), an opportunistic pathogen of the female reproductive tract. How this symbiosis affects infection outcomes and the host cell innate immune response is poorly understood. Here, we show that infection with T. vaginalis in symbiosis with M. hominis or M. hominis alone triggers a noncanonical type I interferon, interferon-epsilon (IFNε), but infection with T. vaginalis alone does not. We also demonstrate that extracellular vesicles (TvEVs) produced by the parasite downregulate host cell IFNε, counteracting this symbiont-driven response and elevating infection. We further demonstrate that IFNε, a hormonally regulated cytokine produced in the human reproductive system, is protective against T. vaginalis cytoadherence and cytolysis of host cells. These studies provide insight into how a parasite and its bacterial symbiont work in concert to regulate host cell innate immune responses to drive infection.

Keywords: Mycoplasma hominis; Trichomonas vaginalis; extracellular vesicles; innate immunity; interferon.


Conflict of interest statement

Competing interests statement:The authors declare no competing interest.

Figures

Fig. 1.
Fig. 1.
TvEVs increase parasite burden and parasite-mediated host cell cytolysis. (A) Schematic depicting infection of host cells with T. vaginalis. BPH-1 cells were seeded onto 96-well plates to confluency and then treated with 10 µg/mL of TvEVs or BSA for 6 h prior to infection with CFSE-labeled T. vaginalis strain B7RC2 for 24 h. (B) Entire wells, treated with either BSA or TvEVs, were imaged on the Operetta® CLS platform and analyzed using Harmony™ software. (Scale bar, 100 µm.) (C) The number of T. vaginalis Left in the well after 24 h was enumerated using CFSE staining to quantify parasites normalized to BSA control. Data are depicted as fold change in adherence compared to BSA control. Bars, mean ± SD. N = 3 wells/experiment, 51 fields of view/well, 3 experiments total. Numbers above bars indicate P-values for unpaired two-tailed Student’s t test as compared to BSA control. (D) Percent of host cell survival was quantified by enumerating the number of host cells Left in the well after 24 h compared to uninfected controls. Data are depicted as fold change in adherence compared to BSA control. Bars, mean ± SD. N = 3 wells/experiment, 51 fields of view/well, 3 experiments total. Numbers above bars indicate P-values for unpaired two-tailed Student’s t test as compared to BSA control.
Fig. 2.
Fig. 2.
TvEVs down-regulate innate immune genes and pathways. (A) Schematic depiction of RNA-seq experiment. (B) Principal Component Analysis (PCA) showing distinct clustering of mock-treated BPH-1 cells (Mock; n = 5) and TvEV-treated BPH-1 cells (TvEV; n = 4) from RNA-seq data. (C) Heatmap of row z-score transformed 832 genes (143 upregulated and 689 downregulated; Log2(FC) ≥ 1 or Log2(FC) ≤ −1; padj ≤ 0.05) identified as differentially expressed between mock and TvEV-treated BPH-1 cells. (D) Volcano plot depicting differences in gene expression between TvEVs and mock-treated BPH-1 cells. The x axis corresponds to the log2 fold change in gene expression and the y axis indicates the adjusted P value. Genes with a −log10 P value of 1.3 or greater (P value of ≤ 0.05) and a log2 fold change −1 ≤ or ≥ 1 were deemed significantly differentially expressed. (E) Bubble chart showing results of Gene Set Enrichment Analysis (GSEA) for the Hallmarks dataset in TvEV-treated (Left) and mock-treated BPH-1 cells (Right). Color of bubble represents normalized enrichment score (gold signifies pathway enriched compared to mock and blue signifies pathway is enriched in mock condition). SetSize indicates number of genes in the indicated pathway. −log10(padj) value indicated by intensity of shading.
Fig. 3.
Fig. 3.
TvEVs block IFNε-mediated nuclear translocation of pSTAT1 and pSTAT2 in prostate cells. (A and B) pSTAT1/2 immunofluorescence in BPH-1 cells treated with either TvEVs (50 µg/mL), IFNε (500 ng/mL), or TvEVs (50 µg/mL) + IFNε (500 ng/mL). Depicted are DAPI staining BPH-1 and parasite nuclei (Blue) and pSTAT1 or pSTAT2 (Green). (Scale bar, 20 µm.) (C) Left, quantification of percent of cells that at positive for nuclear pSTAT1. Right, Mean Fluorescent intensity (MFI) of nuclear pSTAT1. Bars, mean ± SD. N = 3 wells/experiment, 9 fields of view/well, 3 experiments total. Numbers above bars indicate P-values for one-way ANOVA, Dunnett’s multiple comparisons test compared to mock control. (D) Left, quantification of percent of cells that at positive for nuclear pSTAT1. Right, MFI of nuclear pSTAT2. Bars, mean ± SD. N = 3 wells/experiment, 9 fields of view/well, 3 experiments total. Numbers above bars indicate P-values for one-way ANOVA, Dunnett’s multiple comparisons test compared to mock control.
Fig. 4.
Fig. 4.
T. vaginalis and M. hominis elicit distinct and overlapping responses in host gene expression during infection. (A) Heatmap of row z-score transformed genes identified as differentially expressed normalized to mock. (BD) Volcano plot depicting differences in gene expression between (B) Tv infected cells compared to mock-treated BPH-1 cells, (C) Mh infected cells compared to mock-treated BPH-1 cells, and (D) TvMh infected cells compared to mock-treated BPH-1 cells. The x axis corresponds to the log2 fold change in gene expression and the y axis indicates the adjusted P value. Genes with a −log10 P value of 1.3 or greater (P value of ≤ 0.05) and a log2 fold change −1 ≤ or ≥ 1 were deemed significantly differentially expressed. (E) Venn diagram showing overlap in the number upregulated DEGs for each infection compared to mock control cells. (F) Venn diagram showing overlap in of the number downregulated DEGs for each infection compared to mock control cells.
Fig. 5.
Fig. 5.
GSEA reveals that T. vaginalis association with M. hominis drives enrichment of the IFNα response pathway. (A) BubbleMAP showing results of GSEA for immune pathways in Hallmarks dataset for BPH-1 cells infected with Tv, Mh, or TvMh. Color and area of bubble represents normalized enrichment score (NES). Blue signifies pathway enriched in first class, and red signifies enrichment in second class. Intensity of color indicates false discovery rate (FDR). (B) Top, GSEA enrichment plot showing Hallmark IFN alpha response of Mh infected BPH-1 cells compared to Tv infected BPH-1 cells. Bottom, GSEA enrichment plot showing Hallmark IFN alpha response of TvMh infected BPH-1 cells compared to Tv infected BPH-1 cells. (C) Heatmap of Log2(FC) of individual genes in the interferon alpha response pathway Hallmarks dataset for samples normalized to Mock control. Rows with an X through them represent genes with transcripts below limit of detection in the RNA-seq data.
Fig. 6.
Fig. 6.
IFNε is protective against T. vaginalis cytoadherence and cytolysis. (A) Top, Schematic depicting infection of host cells with T. vaginalis. BPH-1 cells were seeded onto 96-well plates to confluency and then treated with 500 ng/mL of IFNε or mock treated for 6 h prior to infection with CFSE-labeled T. vaginalis strain B7RC2 for 2 and 24 h. (B) Representative fluorescence image depicting BPH-1 cells mock or IFNε (500 ng/mL) treated and then infected with T. vaginalis at 2 and 24 h postinfection. Hoechst staining for BPH-1 and parasite nuclei (Blue) and CFSE-labeled T. vaginalis (Green). (Scale bar, 20 µm.) (C) Percent of host cell survival was quantified by enumerating the number of host cells Left in the well after 2 and 24 h compared to uninfected controls. Bars, mean ± SD. N = 3 wells/experiment, 51 fields of view/well, 4 experiments total. Numbers above bars indicate P-values for two-way ANOVA, Dunnett’s multiple comparisons test compared to mock control. (D) The number of T. vaginalis Left in the well after 2 and 24 h was enumerated using CFSE staining to quantify parasites normalized to Mock-treated control. Bars, mean ± SD. N = 3 wells/experiment, 51 fields of view/well, 4 experiments total. Numbers above bars indicate P-values for two-way ANOVA, Dunnett’s multiple comparisons test compared to mock control. (E) Quantification of parasite adherence to BPH-1. Data are depicted as fold change in adherence compared to mock-treated control. Bars, mean ± SD. N = 3 wells/experiment, 4 experiments total. Numbers above bars indicate P-values for Welch’s t test compared to mock control. (F) Percent of host cell survival was quantified by enumerating the number of host cells Left in the well after 24 h compared to uninfected controls. Bars, mean ± SD. N = 3 wells/experiment, 3 experiments total. Numbers above bars indicate P-values for Welch’s t test compared to mock control. (G) Quantification of parasite adherence to Ect1. Data are depicted as fold change in adherence compared to mock-treated control. Bars, mean ± SD. N = 3 wells/experiment, 3 experiments total. Numbers above bars indicate P-values for Welch’s t test compared to mock control.

Similar articles

References

    1. Dalby J., Stoner B. P., Sexually transmitted infections: Updates from the 2021 CDC guidelines. Am. Fam. Physician 105, 514–520 (2022). - PubMed
    1. Rowley J., et al. , Chlamydia, gonorrhoea, trichomoniasis and syphilis: Global prevalence and incidence estimates, 2016. Bull. World Health Organ. 97, 548 (2019). - PMC - PubMed
    1. Kreisel K. M., et al. , Sexually transmitted infections among US women and men: Prevalence and incidence estimates, 2018. Sex. Transm. Dis. 48, 208–214 (2018). - PMC - PubMed
    1. Yang S., et al. , Trichomonas vaginalis infection-associated risk of cervical cancer: A meta-analysis. Eur. J. Obstet. Gynecol. Reprod. Biol. 228, 166–173 (2018). - PubMed
    1. Brotman R. M., et al. , Association between Trichomonas vaginalis and vaginal bacterial community composition among reproductive-age women. Sex. Transm. Dis. 39, 807–812 (2012). - PMC - PubMed

MeSH terms

LinkOut - more resources