. 2025 Jul 22;44(7):115826.
doi: 10.1016/j.celrep.2025.115826. Epub 2025 Jun 24.

De novo assembly of RNA m6A modification factors into viral genome-associated nuclear bodies drives HCMV RNA accumulation

Affiliations

De novo assembly of RNA m6A modification factors into viral genome-associated nuclear bodies drives HCMV RNA accumulation

Rebecca C Grande et al. Cell Rep. .

Abstract

The factors that install and recognize N6-methyladenosine (m6A) on RNA to regulate gene expression are well characterized, but how their spatial organization responds to physiological stress, including infection, is unclear. Here, we show that human cytomegalovirus (HCMV) infection induces accumulation of m6A methyltransferase subunits, including WTAP, together with nuclear m6A reader YTHDC1, into distinctive, membraneless nuclear bodies (NBs) overlapping with incoming virus genomes and immediate-early (IE) RNA transcripts. De novo assembly and integrity of these DNA-associated, IE, virus-activated NBs requires RNAPII transcription, METTL3 m6A methyltransferase activity, and m6A recognition by YTHDC1, but not new protein synthesis. Depleting YTHDC1 or WTAP limits the accumulation of critical HCMV RNAs required for virus DNA replication, interfering with virus reproduction. This reveals a surprising strategy whereby a discrete sub-nuclear RNA biogenesis compartment replete with RNAPII and m6A modification components is swiftly consolidated in proximity to infecting HCMV genomes to initialize and sustain virus gene expression.

Keywords: CP: Microbiology; CP: Molecular biology; RNA m(6)A modification; epitranscriptomics; herpesvirus; infectious stress; nuclear bodies.


Conflict of interest statement

Declaration of interests The authors declare no competing interests.

Figures

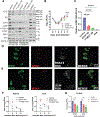
Figure 1.
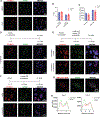
Figure 1.. Accumulation and co-localization of WTAP and YTHDC1 in sub-nuclear bodies in response to HCMV infection
(A) NHDFs either uninfected or infected with HCMV Ad169-GFP were fixed at the indicated times (hpi) and the subcellular distribution of WTAP or YTHDC1 was visualized by indirect IF using a Leica CTR5000 epifluorescent microscope. Nuclei were identified by DAPI staining (blue in merged image) and HCMV-positive cells by GFP fluorescence. (B) NHDFs infected as in (A), except cells were fixed at 6 hpi, probed simultaneously with WTAP and YTHDC1 antibodies and visualized using a Zeiss 880 confocal microscope. (C) WTAP and YTHDC1 indirect IF signal intensity in HCMV-infected cells was plot profiled across an indicated section (white line through WTAP and YTHDC1 NB in 6 hpi images in B) to evaluate co-localization. (D) Quantification of WTAP NBs detected alone compared with WTAP NBs detected within the same NB as YTHDC1 NBs using ImageJ macros (n = 3, 100 cells per replicate) and shown as percentage of NBs (±SD). (E) As in (D) except YTHDC1 NBs detected alone were compared with those that overlap with WTAP. ***p = 0.0002; ****p < 0.0001 by Student’s t test. Scale bar, 10 μm.
Figure 2.
Figure 2.. Induction of WTAP and YTHDC1 NBs by HCMV infection requires continuous RNAPII transcription, but not protein synthesis
(A) NHDFs treated with DMSO or cycloheximide (CHX) for 1 h were infected with HCMV Ad169-GFP, fixed at 6 hpi, probed simultaneously with WTAP and YTHDC1 antibodies, and visualized by confocal microscopy. Nuclei were identified by DAPI staining (blue in merged image). Scale bar, 20 μm. (B) Quantitation of WTAP and YTHDC1 NBs detected within the same domain in HCMV-infected cells treated with either DMSO or CHX using ImageJ macros (n = 3, 100 cells per replicate) and shown as a percentage of NBs (±SD). (C) Relative abundance of WTAP and YTHDC1 in the same NBs measured by the MFI of indirect immunofluorescent signals within NBs (n = 3, 100 cells per replicate), ±SD. (D) NHDFs infected with TB40/E were treated with water or α-amanitin for 0–6 hpi. Following fixation, WTAP or YTHDC1 were visualized by epifluorescence microscopy. Scale bar, 20 μm. (E) As in (D), except after 6 h, cultures were washed with PBS and treated with media + water or α-amanitin for an additional 3 h before fixing. Scale bar, 10 μm. (F) As in (D), except that water or α-amanitin was only added from 6 to 9 hpi before fixing. Scale bar, 10 μm. (G) NHDFs infected with HCMV Ad169-GFP were fixed at 6 hpi, probed simultaneously with antibodies recognizing WTAP and RNAPII phosphorylated at serine 5 (RNAPII S5P), and visualized by confocal microscopy. Nuclei were identified by DAPI staining. Scale bar, 10 μm. (H) IF signal intensity corresponding to WTAP and RNAPII S5P was plot profiled across two sections (indicated by numbered white lines in merged image in G) to determine the extent of co-localization.
Figure 3.
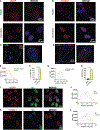
Figure 3.. Virus dsDNA genomes are components of YTHDC1/WTAP NBs
(A and B) NHDFs infected with either wild-type or UV-inactivated HCMV (Ad169) were fixed at 6 hpi and WTAP (A) or YTHDC1 (B) were visualized by confocal microscopy. Nuclei were identified by DAPI staining (blue in merged image). Scale bar, 10 μm. (C) NHDFs infected with EdC/EdA-labeled HCMV (Ad169, MOI = 1) were fixed at 6 hpi. Genomes were visualized by click chemistry using an azide dye. WTAP was visualized by indirect IF and nuclei stained using DAPI. Scale bar, 20 μm. (D) As in (C), but YTHDC1 was visualized. (E) EdC/EdA-labeled HCMV and WTAP signal intensity were plot profiled across an indicated section (white line in C) to determine relative localization of WTAP with HCMV genome. (F) Percentage of EdC/EdA-labeled HCMV genomes localized alone or adjacent to WTAP. ****p < 0.0001 by Student’s t test, n = 3. (G) As in (E) but plot profiling EdC/EdA labeled HCMV and YTHDC1 signal intensity across an indicated section (white line in D). (H) As in (F) but calculated for percentage of EdC/EdA-labeled HCMV adjacent to YTHDC1. ***p = 0.0005 by Student’s t test, n = 3. (I) NHDFs infected with HCMV (Ad169, MOI = 3) were fixed at 6 hpi, probed simultaneously with WTAP and IE2 antibodies and visualized by confocal microscopy. Nuclei were identified by DAPI staining (blue in merged image). Scale bar, 10 μm. (J) WTAP and IE2 indirect IF signal intensity in HCMV-infected cells was plot profiled across an indicated section (white line through WTAP and IE2 NB in merged image in I) to evaluate co-localization. (K) As in (I), except antibodies against YTHDC1 and IE2 were used. (L) As in (J), except YTHDC1 and IE2 indirect IF signal intensity was plot profiled across an indicated section (white line through YTHDC1 and IE2 NB in merged image in K).
Figure 4.
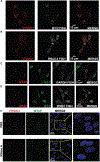
Figure 4.. YTHDC1/WTAP NBs are selective sites of HCMV IE RNA accumulation
(A and B) NHDFs infected with HCMV TB40/E in the presence of CHX were fixed at 6 hpi. YTHDC1 was visualized by indirect IF, and HCMV IE1/2 mRNA (A) or HCMV RNA5.0 (B) was visualized using smFISH probes. Scale bar, 10 μm. (C and D) As in (A), except infected cells were identified using indirect IF for HCMV IE1/2 proteins, and the cellular GAPDH (C) or IFNB1 (D) mRNA was visualized using smFISH probes. (E) HCMV TB40/E-infected cells were permeabilized at 6 hpi and subsequently treated with PBS or RNase A before fixation and YTHDC1 or WTAP visualization. DAPI stained nuclei are included in the merged images. Scale bar, 20 μm.
Figure 5.
Figure 5.. Enrichment of WTAP NBs, but not authentic DIVA NBs containing WTAP and YTHDC1 in uninfected cells expressing an HCMV MIEP-driven reporter
ARPE-19 cells transduced with a lentivirus containing an EGFP reporter gene driven by the HCMV MIEP, the cellular PGK promoter (PGK), or a promoterless EGFP control (empty) were fixed, and WTAP or YTHDC1 was detected by indirect IF. (A) Representative images showing WTAP and YTHDC1 nuclear signal in cells expressing EGFP from the MIEP and PGK promoters. White arrows indicate WTAP NB location. Scale bar, 5 μm. (B) The percentage of EGFP-positive cells in cultures expressing MIEP (n = 83 cells) vs. PGK-driven reporters (n = 50 cells) was visually quantified. ****p < 0.00001; error bars represent ±SD. (C) Total protein isolated from lentivirus-transduced cultures was harvested, fractionated by SDS-PAGE, and analyzed by immunoblotting with the indicated antibodies. (D) The percentage of cells in cultures expressing MIEP (n = 106 cells) vs. PGK-driven reporters (n = 81 cells) vs. promoterless EGFP reporters (empty, n = 73 cells) was visually quantified. ns, non-significant, p > 0.1; ****p < 0.00001; error bars represent ±SD.
Figure 6.
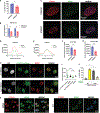
Figure 6.. Regulation of DIVA NB composition by METTL3 m6A methyltransferase activity and m6A recognition by YTHDC1
(A) Poly(A)+ RNA was isolated from HCMV-infected NHDFs treated with the METTL3 methyltransferase inhibitor (STM2457) or control compound (STM2120), and m6A methylation levels were quantified using a commercial kit. *p = 0.0159 by Student’s t test, n = 3. (B) HCMV-infected NHDFs were treated with STM2120 or STM2457, and total RNA was collected at 24 hpi. RNA4.9 and UL54 levels were measured by RT-qPCR. Cycle threshold (Ct) values were normalized to PP1A. n = 3. Error bars indicate ±SD. (C–G) As in (B), except cells were fixed at 6 hpi, probed simultaneously with WTAP and YTHDC1 antibodies, and visualized by confocal microscopy (C). Nuclei were identified by DAPI staining (blue in merged image). WTAP and YTHDC1 indirect IF signal intensity in HCMV-infected cells treated with STM2120 (D) or STM2457 (E) was plot profiled across an indicated section (white line through WTAP and YTHDC1 NBs shown in C) to evaluate relative localization of each protein. MFI of WTAP NBs (F) or YTHDC1 NBs (G) was measured in HCMV-infected NHDFs treated with STM2120 vs. STM2457. **p = 0.002 by Student’s t test, n = 3; ns, not significant p > 0.05, n = 3. (H) ARPE-19 cells ectopically expressing an YTHDC1-mClover fusion (WT or mut) were transfected with siRNA to deplete endogenous YTHDC1, infected with HCMV TB40/E (MOI = 10), and fixed at 15 hpi. HCMV IE2 and WTAP signal were visualized by indirect IF. (I) As in (H) except fluorescence intensity of YTHDC1-mClover or WTAP signals in DIVA NBs was measured in 80 or more mClover-positive cells. Each dot represents the fluorescence intensity of the indicated protein in a single NB positive for both mClover and WTAP. ****p < 0.0001 by Student’s t test, n = 2. (J) As in (H) except the percentage of WTAP NBs colocalizing with either WT-YTHDC1-mClover- or mut-YTHDC1-mClover-positive bodies was quantified. *p < 0.05 by Student’s t test, n = 2. (K) NHDFs treated with DMSO or C11 for 2 h were infected with HCMV (+ DMSO or C11). After 24 h, infected cells were fixed, and WTAP and YTHDC1 were detected by indirect IF and imaged by epifluorescence microscopy. Nuclei were identified by DAPI staining (blue in merged image). Scale bar, 10 μm.
Figure 7.
Figure 7.. Depletion of DIVA NB components YTHDC1 and WTAP inhibits virus gene expression and restricts virus reproduction
(A) NHDFs transfected with non-silencing control siRNA or siRNA targeting WTAP or YTHDC1 were infected with HCMV (TB40/E). Indicated infected cultures were treated with the YTHDC1 ligand C11, which inhibits YTHDC1 m6A recognition, the METTL3 inhibitor STM2457, or the structurally related, inactive control compound STM2120. Total protein was collected 72 hpi, fractionated by SDS-PAGE, and analyzed by immunoblotting with the indicated antibodies. Relative migration of IE1 (72 kDa), full-length IE2 (86 kDa), and late IE2 isoforms (40 kDa, 60 kDa) are indicated. (B) NHDFs were transfected with siRNA and infected as in (A). Infectious virus was quantified from supernatants collected at the indicated days post infection and virus titers determined by TCID50. ****p < 0.0001 by Student’s t test, n = 3. Error bars indicate ±SD. (C) NHDFs were infected as in (A), except DNA was isolated at 72 hpi. PAA treatment, which inhibits virus DNA synthesis, provides a positive control. HCMV DNA levels were quantified by realtime qPCR, and Ct values were normalized to cellular RPL19 gene values. ****p < 0.0001 by Student’s t test, n = 3. (D and E) HCMV TB40/E-infected NHDFs were fixed at 6 hpi. HCMV IE1/2 and WTAP were visualized by indirect IF, and HCMV RNA4.9 (D) or UL54 mRNA (E) was visualized using smFISH probes. Scale bar, 20 μm. (F) NHDFs infected as in (A) were treated with actinomycin D at 24 hpi, after which total RNA was collected at post-treatment time points indicated. RNA4.9 and UL54 levels were measured by RT-qPCR. Ct values were normalized to PP1A. Error bars indicate ±SD. (G) As in (F), except NHDFs were pulse labeled with 5-ethynyluridine at 24 hpi for 20 min. Nuclear RNA was collected, and newly synthesized RNA4.9 and UL54 levels were measured by RT-qPCR. **p ≤ 0.01 by Student’s t test.

References

    1. Engel M, Eggert C, Kaplick PM, Eder M, Röh S, Tietze L, Namendorf C, Arloth J, Weber P, Rex-Haffner M, et al. (2018). The Role of m6A/m-RNA Methylation in Stress Response Regulation. Neuron 99, 389–403.e9. 10.1016/j.neuron.2018.07.009. - DOI - PMC - PubMed
    1. Murakami S, and Jaffrey SR (2022). Hidden codes in mRNA: Control of gene expression by m6A. Mol. Cell 82, 2236–2251. 10.1016/j.molcel.2022.05.029. - DOI - PMC - PubMed
    1. Sendinc E, and Shi Y (2023). RNA m6A methylation across the transcriptome. Mol. Cell 83, 428–441. 10.1016/j.molcel.2023.01.006. - DOI - PubMed
    1. He PC, and He C (2021). m6A RNA methylation: from mechanisms to therapeutic potential. EMBO J. 40, e105977. 10.15252/embj.2020105977. - DOI - PMC - PubMed
    1. Ke S, Pandya-Jones A, Saito Y, Fak JJ, Vågbø CB, Geula S, Hanna JH, Black DL, Darnell JE, and Darnell RB (2017). m6A mRNA modifications are deposited in nascent pre-mRNA and are not required for splicing but do specify cytoplasmic turnover. Genes Dev. 31, 990–1006. 10.1101/gad.301036.117. - DOI - PMC - PubMed

LinkOut - more resources