. 2025 Aug 1;329(2):E210-E225.
doi: 10.1152/ajpendo.00460.2024. Epub 2025 Jun 25.

Sugar type and route of delivery influence insulin and glucose-dependent insulinotropic polypeptide responses in rats

Affiliations

Sugar type and route of delivery influence insulin and glucose-dependent insulinotropic polypeptide responses in rats

A Valentina Nisi et al. Am J Physiol Endocrinol Metab. .

Abstract

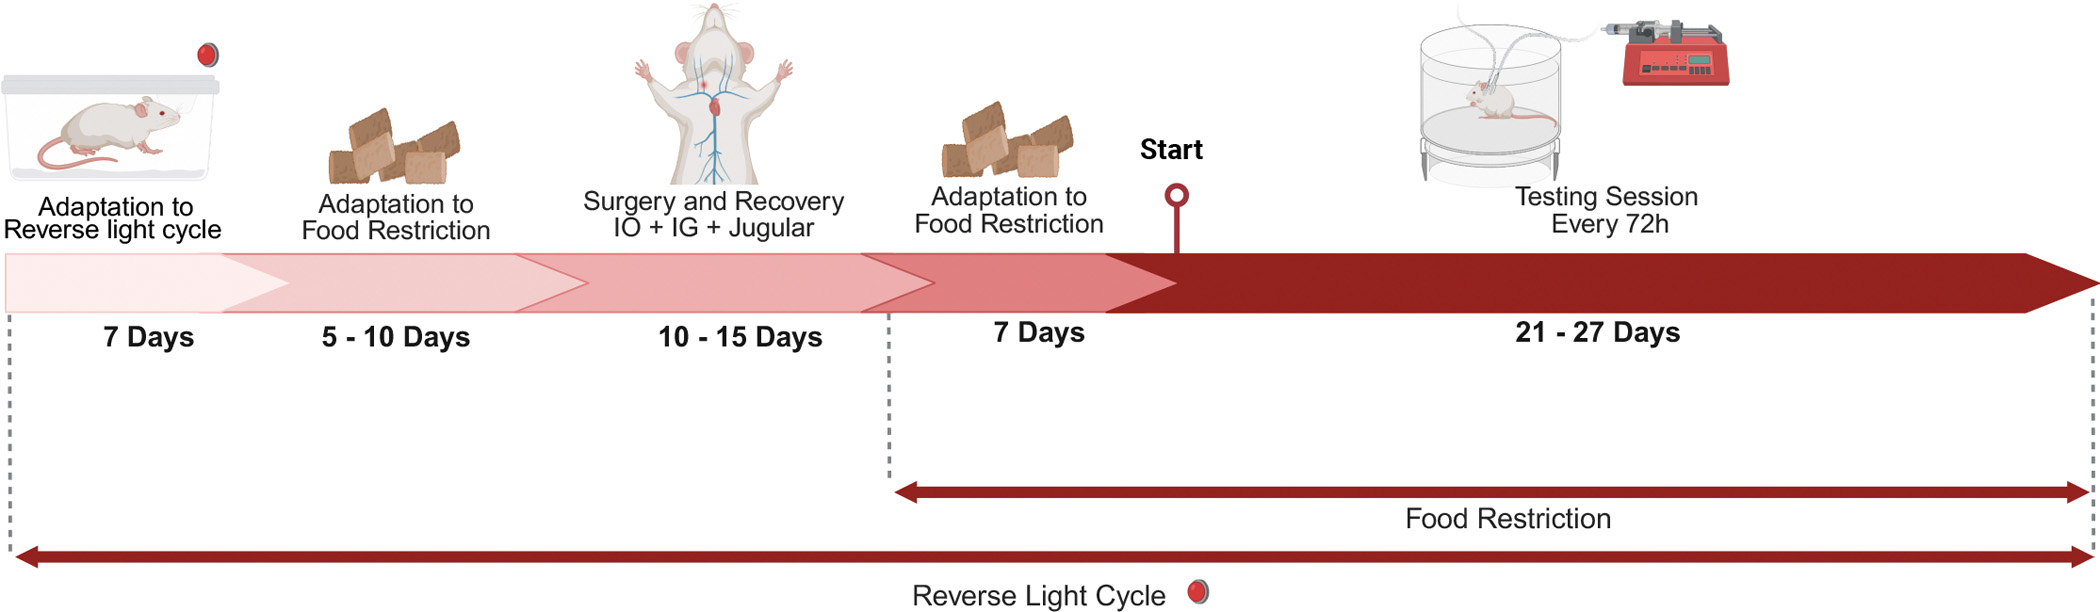
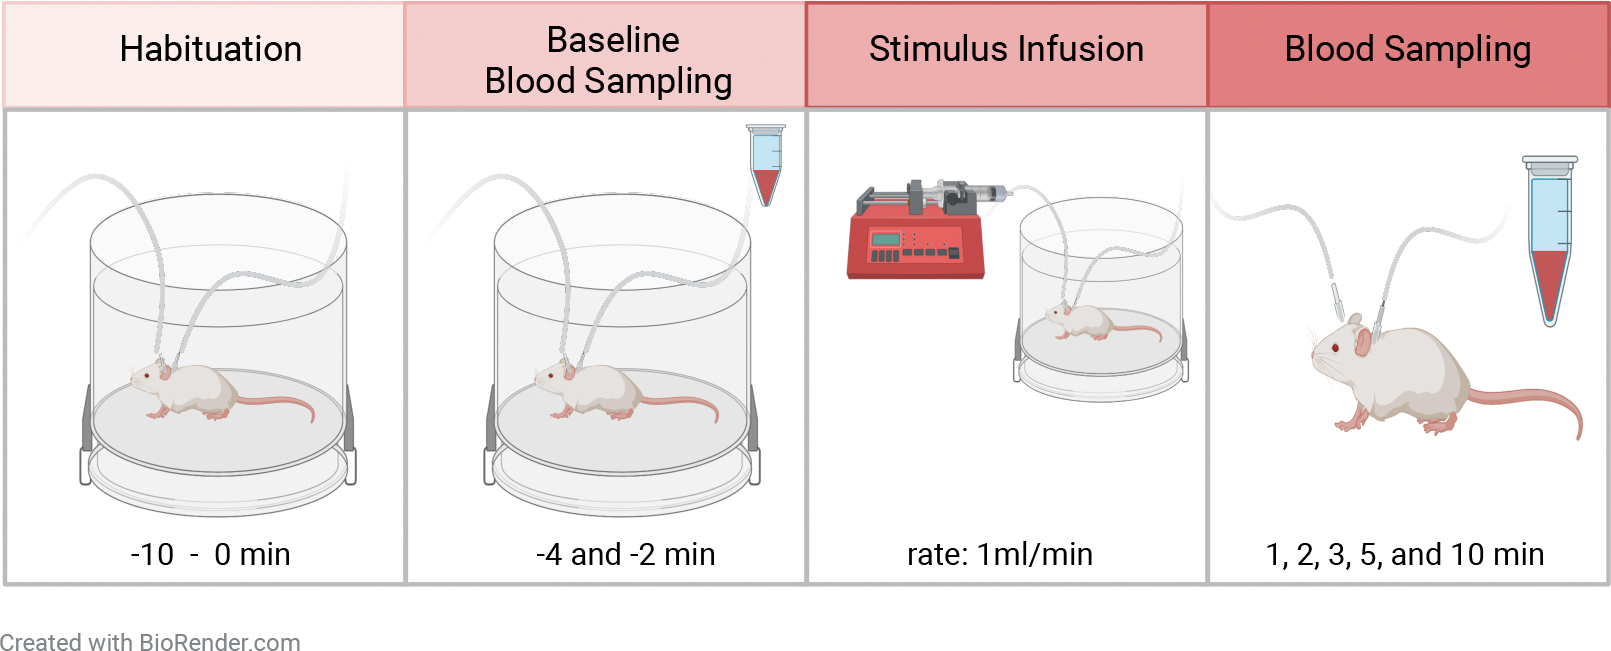
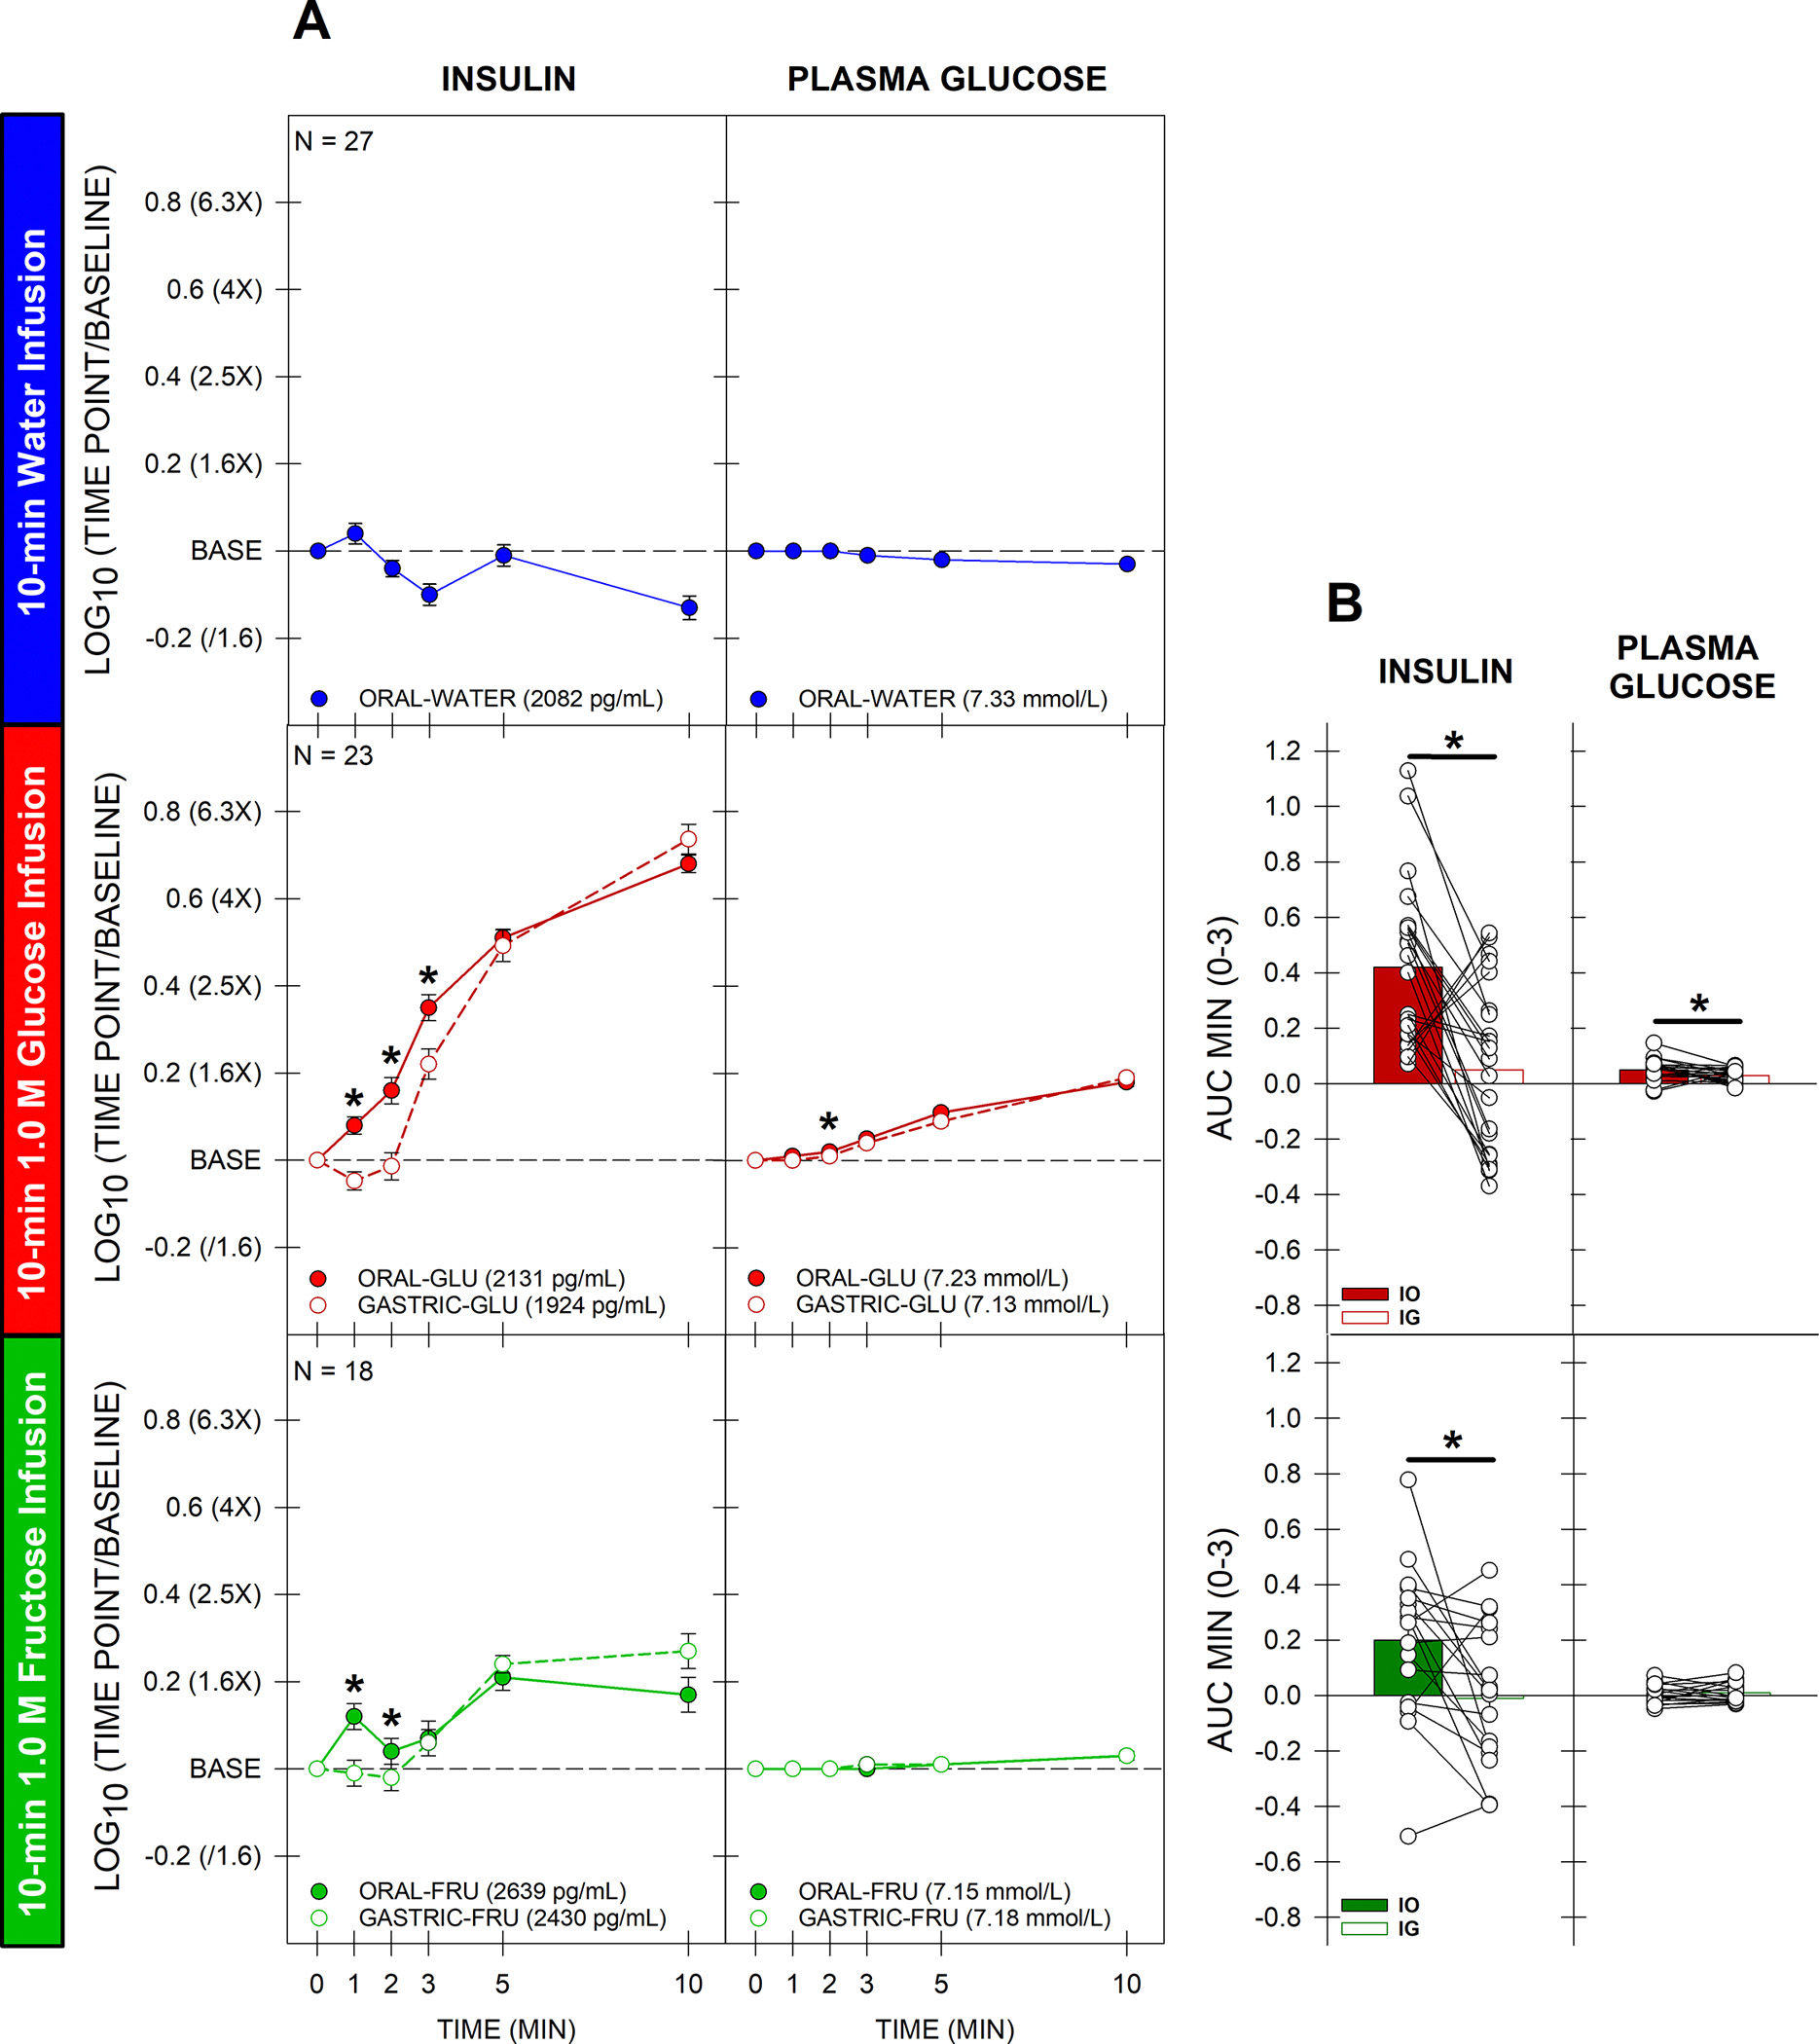
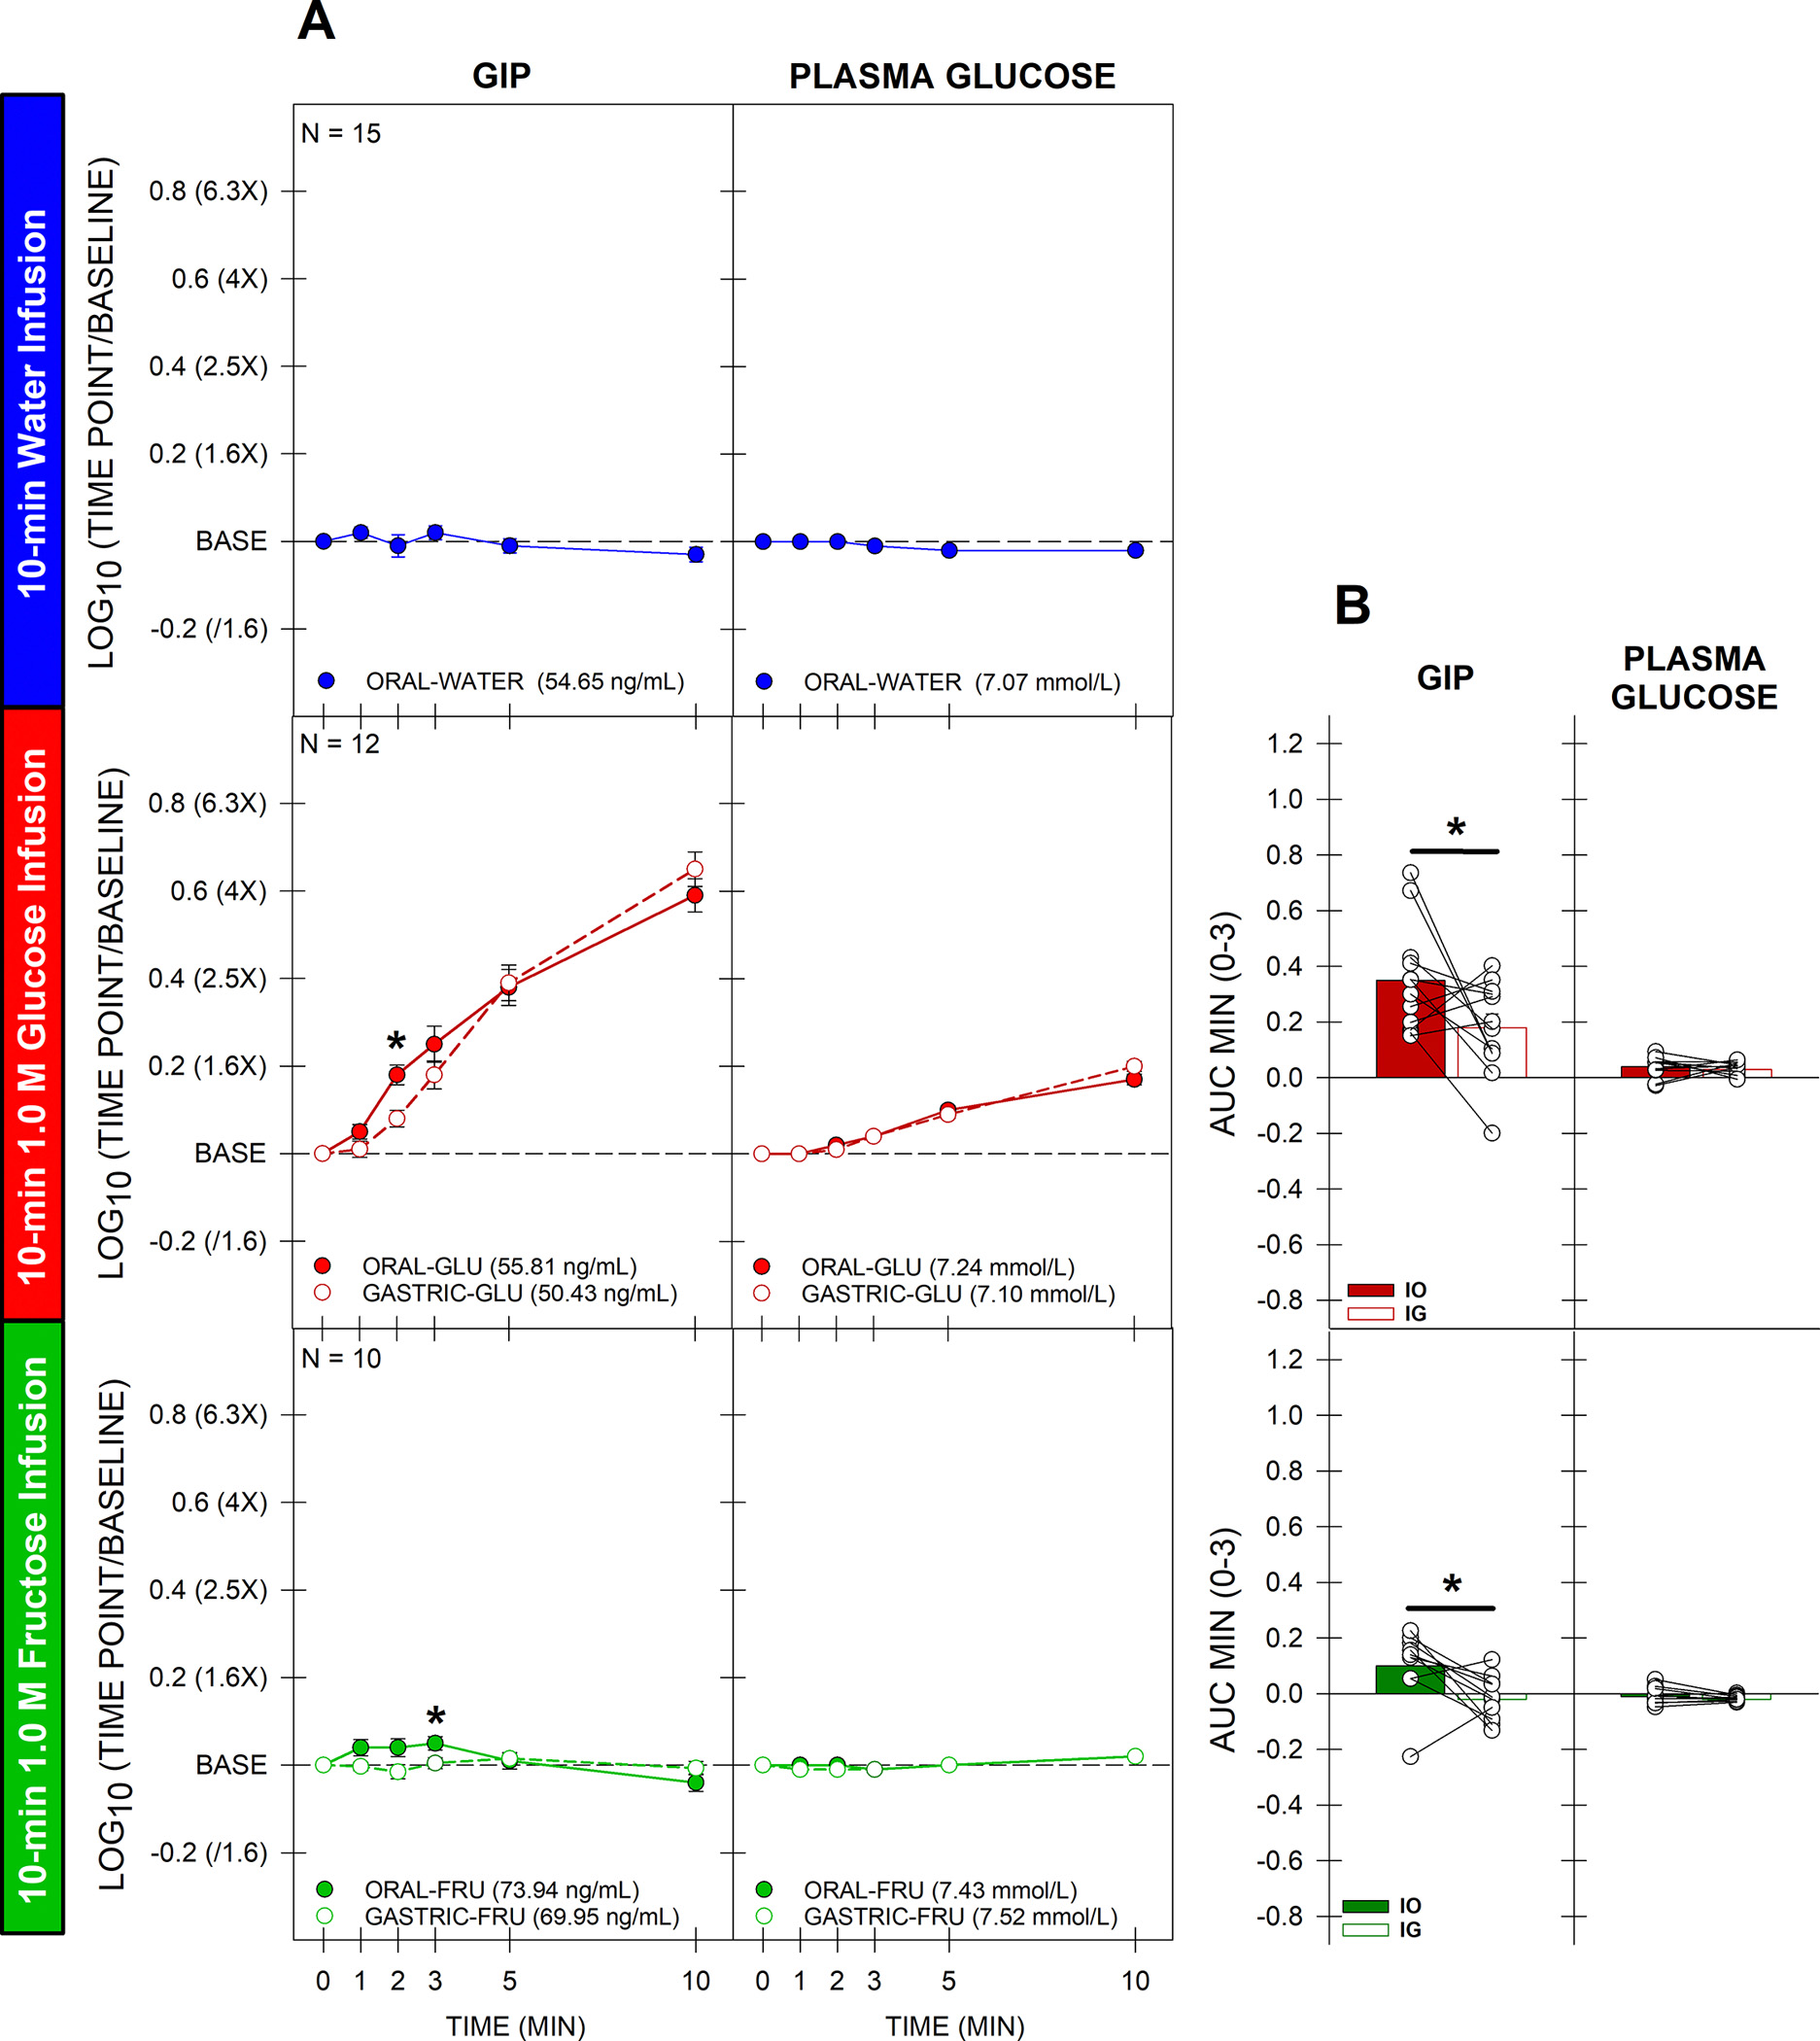
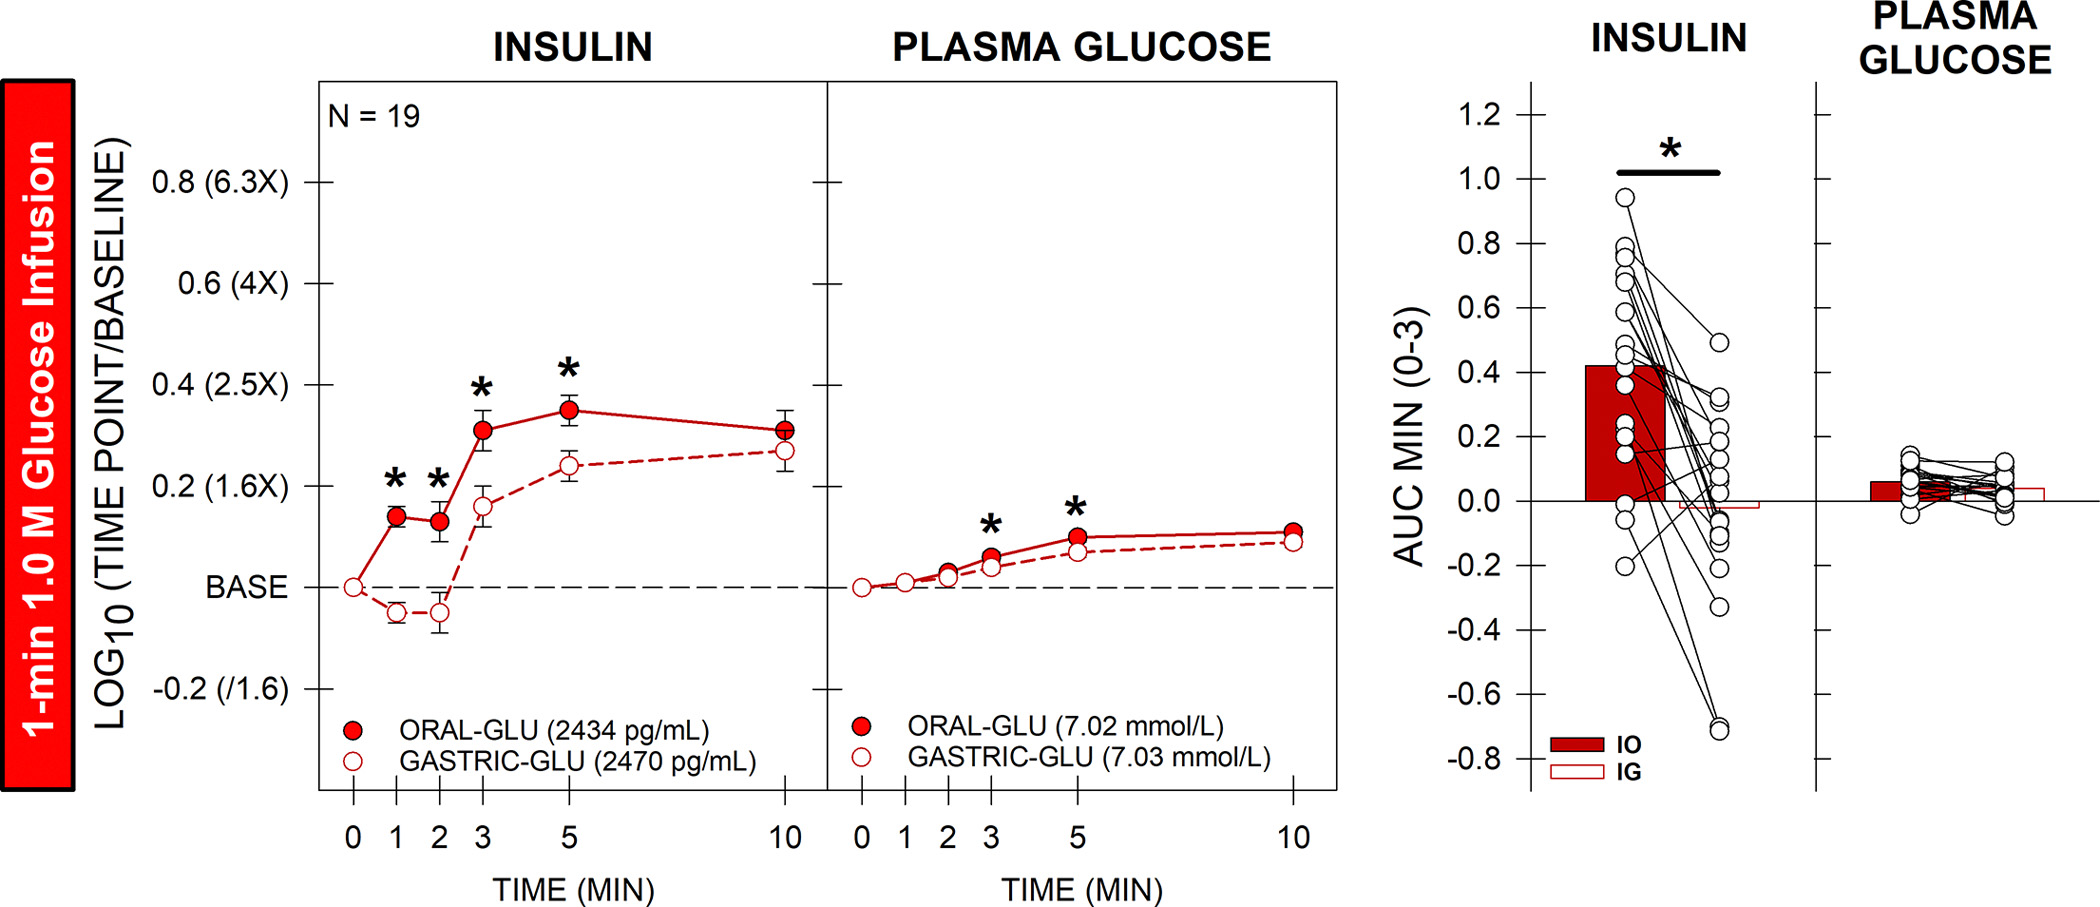
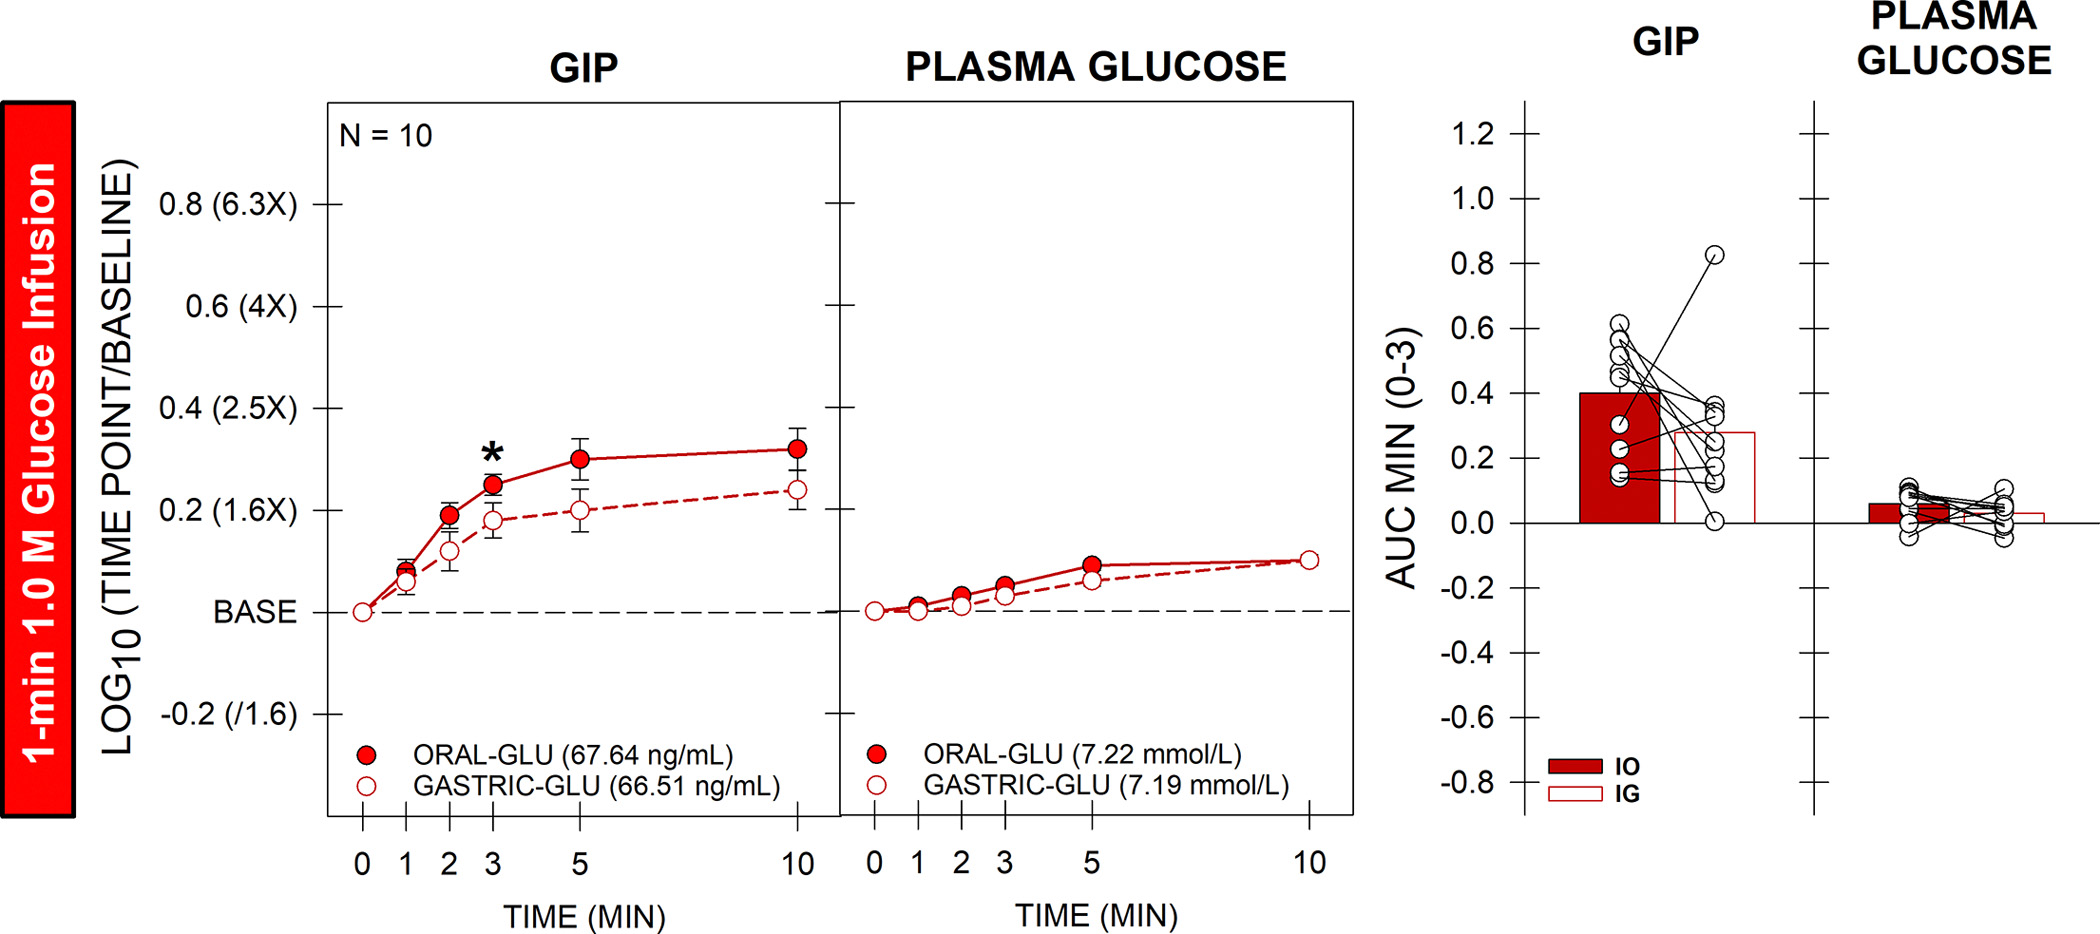
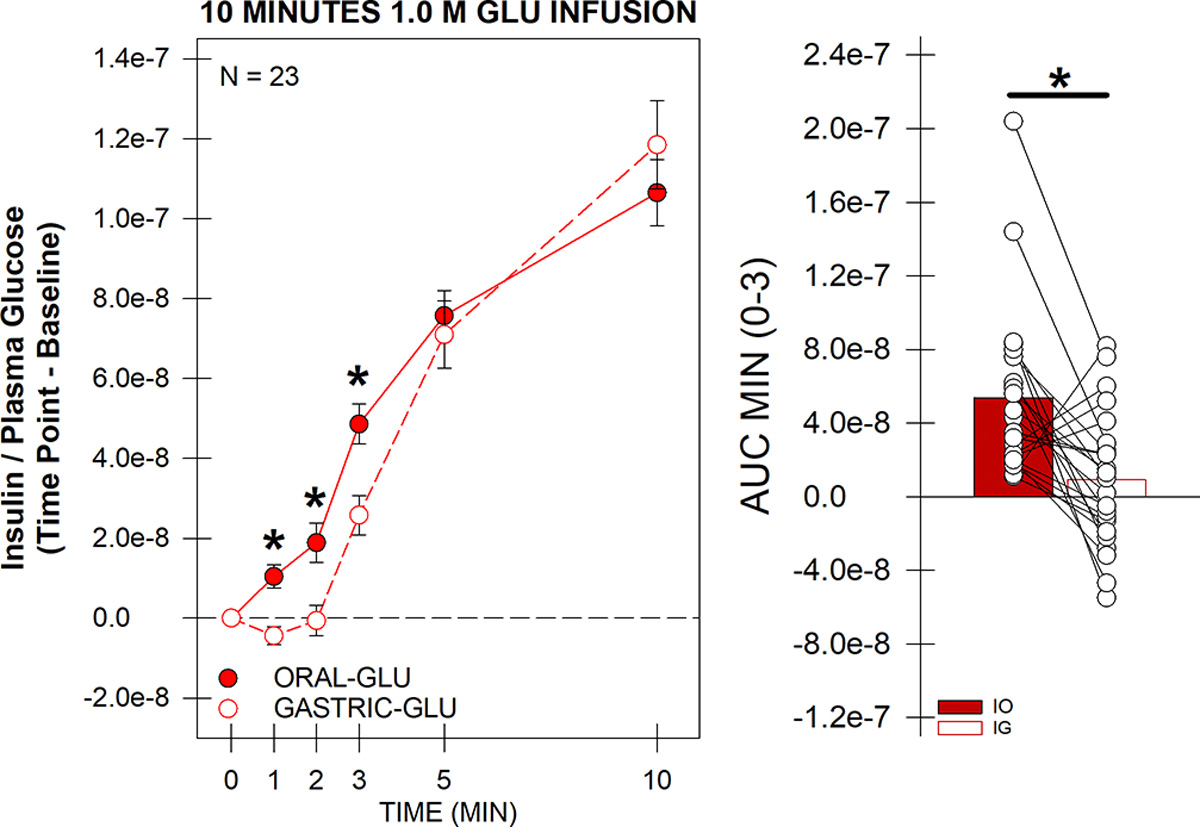
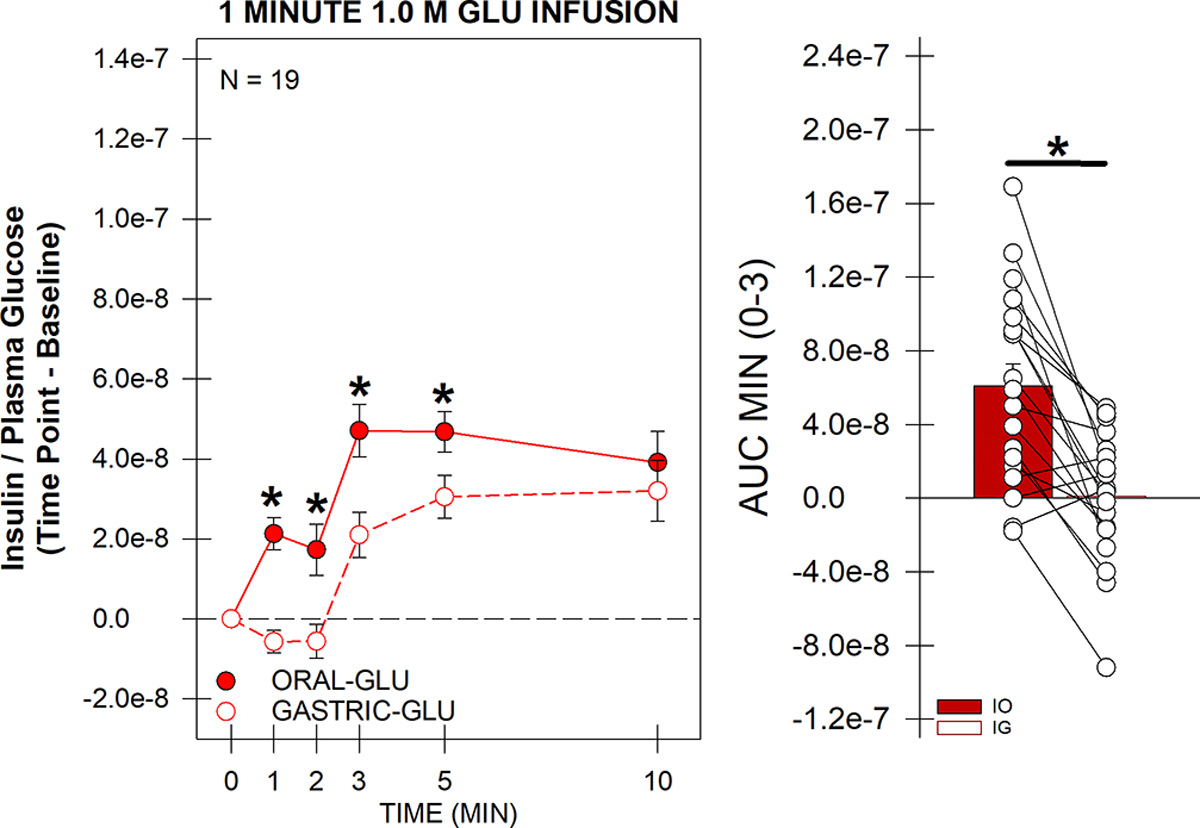
To help resolve the characteristics of orally stimulated endocrine responses to sugar, we developed a novel rat preparation with surgically implanted intraoral (IO) and intragastric (IG) cannulas for stimulus delivery, along with jugular vein catheters for blood sampling, and tested the effects of 1-min and 10-min IO versus IG infusions (1 mL/min) of 1.0 M glucose on plasma levels of insulin, glucose-dependent insulinotropic polypeptide (GIP), and glucose. Oral glucose delivery (1 min and 10 mins) caused a greater (P ≤ 0.05) early rise (1 min) in insulin levels than gastric glucose delivery, also reflected in the 3-min area under the curve (AUC). The 10-min, but not the 1-min, IO glucose infusion also caused a greater (P ≤ 0.05) increase in GIP levels than the IG infusions, as evidenced by the 3-min AUC. Oral delivery of 1.0 M fructose produced marginally (but significantly) higher insulin and GIP levels than gastric fructose delivery, although the difference appeared much smaller than that observed for isomolar glucose, suggesting some degree of chemospecificity and the involvement of a taste type 1 receptor-independent mechanism. Our triple cannulation/catheterization rat preparation is well suited to assess endocrine responses to oral stimulation. By comparing the effects of stimulus infusion into the oral cavity (oral + postoral stimulation) with the stimulus infusion directly into the stomach (only postoral stimulation), we confirmed the primacy of glucose to orally trigger an increase in circulating insulin while controlling for changes in plasma glucose. This approach offers promise for reliably characterizing orally stimulated endocrine responses in rats and potentially in other animal models as well.NEW & NOTEWORTHY We describe an innovative preparation that can effectively characterize orally stimulated endocrine responses during ongoing ingestion in rats. We found that glucose orally triggered an early rise in not only plasma insulin-which in some circumstances was present even as glycemia increased-but also glucose-dependent insulinotropic polypeptide, albeit more weakly. These endocrine responses to orally delivered fructose were weak or nonexistent, confirming the primacy of glucose as the key monosaccharide stimulus.

Keywords: GIP; cephalic phase insulin release; glucose; glucose sensing; metabolism.


Figures

Figure 1.
Figure 1.. Timeline
The rats were acclimated to the facilities and a reverse light cycle (lights ON at 8:00 pm, and OFF at 8:00 am) for one week. Following this, rats were given a week to habituate to the food restriction schedule (food available from 3:00 pm to 8:30 pm). After surgery, rats were let to recover for a minimum of 10 days, during which they received daily health checks and catheter maintenance. During the recovery time rats were on ad libitum. After the recovery period, rats returned to the initial food restriction schedule, and they were introduced to the testing chamber. Rats were habituated to all testing conditions, including oral and gastric water infusions. During each experimental day, 6–8 rats were tested. The stimuli were delivered IG via the gastric cannula or IO via the intraoral cannulas; this method allowed us to have precise control of the presentation of the stimulus by presenting it at a controlled rate (1ml / min) at a specific time between the two delivery routes. The experiment was designed so that testing days were separated by a minimum of 72 hours per rat. Sometimes the period between testing sessions was longer due to catheter patency problems. Blood analysis was performed every third or fourth day. Created in BioRender. Nisi, V. (2025) https://BioRender.com/j41p000.
Figure 2.
Figure 2.. Test Session Timeline.
Testing sessions were conducted during the dark phase. Water was removed at 8:30 am and returned at 3:00 pm. For experimental rats, thirty minutes before the test session, the blocking solution was removed, the catheter was rinsed with sterile saline and refilled with 150ul 7.5% tri-sodium citrate (Sigma). The rat was placed in the testing chamber with elongation tubes attached five to ten minutes before the first sampling time point, to allow for habituation to the testing chamber and to minimize any anticipatory or excitatory effects. Each rat was randomly assigned to receive oral or gastric stimuli. At one end, the elongation tube was connected to either the IO cannula or the IG cannula, depending on the assigned route of delivery. At the other end, the elongation tube was connected to a stimulus syringe pump dispensing at a rate of 1 ml per min. A total of 1 ml of blood per test session was collected, divided into seven sample times at minutes: −4’, −2’ (baselines), 1’, 2’, 3’, 5’, and 10’. At each point ~140 μl of blood was drawn. A 72-h inter-session interval was selected to avoid an anemic state in the animals, which could jeopardize the animal’s health and the validation of the results. To account for normal red blood cells, rats were constantly checked for the packed-cell volume (PCV %), and it remained stable throughout the entire experiment. After the last sample, the jugular vein catheter was flushed with sterile saline and refilled with the blocking solution. The IG and IO cannulas were flushed with deionized water at the end of the experimental day again, and the rat was placed back in the animal cage. Created in BioRender. Nisi, V. (2025) https://BioRender.com/b81w898.
Figure 3.
Figure 3.. Insulin and Plasma glucose 10-min duration infusions:
A shows plasma insulin (left) and plasma glucose (right) levels measured in the jugular vein in response to oral (filled circles) vs gastric (open circles) infusions (1ml/ min) of water (blue), glucose (red) or fructose (green) as a function of time since infusion onset. The top two figures show the response after a 10-min water (blue) infusion. The figures in the middle show the response after a 10-min 1.0 M glucose (red) infusion. The two figures at the bottom show the response after a 10-min 1.0 M fructose (green) infusion. These stimuli were delivered to rats (2–5h water-deprived, 14–19h food-deprived) in a counterbalanced manner (IO vs IG). The vertical axis shows log10 of the time point divided by the baseline, with 0 representing baseline. The log10 transformation makes factor increases symmetrical with factor decreases. The actual plasma concentrations at baseline (−4’, −2’) are shown in parentheses in each panel legend. Every rat received both oral and gastric infusions, but because of technical issues not all rats received every stimulus. Asterisks represent significantly (p≤0.05) greater responses to IO compared to IG infusions (Glucose Infusion: 1-min insulin, p≤0.001; 2-min insulin, p≤0.001; 3-min insulin, p=0.007; 2-min plasma glucose, p = 0.013. Fructose Infusion: 1-min insulin, p=0.004; 2-min insulin, p=0.047). B shows the area under the curve (AUC) from 0–3 min (the initial phase of the response) after 1.0 M glucose (Top, red) IO (filled) vs IG (open) or 1.0 M fructose (Bottom, green) IO vs IG infusion for the insulin (left) and plasma glucose (right) levels. Asterisks represent significantly (p≤0.05) greater responses to IO compared to IG infusions (Glucose Infusion: 3-min AUC insulin, p≤0.001; 3-min AUC plasma glucose, p = 0.022. Fructose Infusion: 3-min AUC insulin, p = 0.016).
Figure 4.
Figure 4.. GIP and Plasma glucose 10-min duration infusions:
A shows GIP (left) and plasma glucose (right) levels measured in the jugular vein in response to oral (filled circles) vs gastric (open circles) infusions (1ml/min) of water (blue), glucose (red) or Fructose (green) as a function of time since infusion onset. The top two figures show the response after a 10-min water infusion. The figures in the middle show the response after a 10-min 1.0 M glucose infusion. The two figures at the bottom show the response after a 10-min 1.0 M fructose infusion. These stimuli were delivered to rats (2–5h water-deprived, 14–19h food-deprived) in a counterbalanced manner (IO vs IG). The vertical axis shows log10 of the time point divided by the baseline, with 0 representing baseline. The log10 transformation makes factor increases symmetrical with factor decreases. The actual plasma concentrations at baseline (−4’, −2’) are shown in parentheses in each panel legend. Every rat received both oral and gastric infusions, but because of technical issues not all rats received every stimulus. Asterisks represent significantly (p≤0.05) greater responses to IO compared to IG infusions (Glucose Infusion: 2-min GIP, p=0.004. Fructose Infusion: 3-min GIP, p=0.020.) Only a subset of rats was tested for GIP levels. B shows the 3-min AUC (the initial phase of the response) after 1.0 M glucose (Top, red) IO (filled) vs IG (open) or 1.0 M fructose (Bottom, green) IO vs IG infusion for the GIP (left) and plasma glucose (right) levels. Asterisks represent significantly (p≤0.05) greater responses to IO compared to IG infusions. (Glucose Infusion: 3-min AUC GIP, p = 0.027. Fructose Infusion: 3-min AUC GIP, p = 0.034).
Figure 5.
Figure 5.. 1-min duration infusion:
Plasma insulin and glucose levels (left) measured in the jugular vein in response to oral (filled circles) vs gastric (open circles) infusions (1ml/ min) of 1.0 M glucose (red) as a function of time since infusion onset. These stimuli were delivered to rats (2–5h water-deprived, 14–19h food-deprived) in a counterbalanced manner (IO vs IG). The vertical axis shows the log10 of the time point divided by the baseline, with 0 representing baseline. The actual plasma concentrations at baseline (−4’, −2’) are shown in parentheses in each panel legend. The graph on the right shows the 3-min AUC (the initial phase of the response) after 1.0 M glucose infusion IO (filled) vs IG (open), for insulin levels (left) and plasma glucose (right). Asterisks represent significantly (p≤0.05) greater responses to IO compared to IG infusions (Glucose Infusion: 1-min insulin, p≤0.001; 2-min insulin, p=0.001; 3-min insulin, p=0.001; 5-min insulin, p=0.002; 3-min plasma glucose, p = 0.003; 5-min plasma glucose, p = 0.006; 3-min AUC insulin, p≤0.001).
Figure 6.
Figure 6.. 1-min duration infusion:
GIP and glucose levels (left) measured in the jugular vein in response to oral (filled circles) vs gastric (open circles) infusions (1ml/ min) of 1.0 M glucose (red) as a function of time since infusion onset. These stimuli were delivered to rats (2–5h water-deprived, 14–19h food-deprived) in a counterbalanced manner (IO vs IG). The vertical axis shows the log10 of the time point divided by the baseline, with 0 representing baseline. The actual plasma concentrations at baseline (−4’, −2’) are shown in parentheses in each panel legend. Every rat received both oral and gastric infusions, but because of technical issues not all rats received every stimulus. The graph on the right shows 3-min AUC (the initial phase of the response) after 1.0 M glucose infusion IO (filled) vs IG (open) for GIP levels (left) and plasma glucose (right). Asterisks represent significantly (p≤0.05) greater responses to IO compared to IG infusions (Glucose Infusion: 3-min GIP, p=0.041). Only a subset of rats was analyzed for GIP levels.
Figure 7.
Figure 7.. Insulin-to-plasma glucose ratio 10-min duration infusion:
insulin (mmol/L) to plasma glucose (mmol/L) ratio responses (left) measured in the jugular vein in response to oral (IO, filled circles) vs gastric (IG, open circles) infusions (1 ml/min) of 1.0 M glucose as a function of time since infusion onset. Rats received both oral and gastric infusions in a counterbalanced manner (IO vs IG). The vertical axis shows the insulin/plasma glucose ratio minus baseline, with 0 representing baseline. Asterisks represent significantly (p≤0.05) greater responses to IO compared to IG infusions, 1-min, p≤0.001; 2-min, p=0.001; 3-min, p=0.001. The graph on the right shows the AUC calculated over the first 3 minutes after infusion onset for IO (filled bar) vs IG (open bar). Asterisks represent significantly (p≤0.05) greater responses to IO compared to IG infusions, p≤0.001.
Figure 8.
Figure 8.. Insulin-to-plasma glucose ratio 1-min duration infusion:
insulin (mmol/L) to plasma glucose (mmol/L) ratio responses (left) measured in the jugular vein in response to oral (IO, filled circles) vs gastric (IG, open circles) infusions (1 ml/min) of 1.0 M glucose as a function of time since infusion onset. Rats received both oral and gastric infusions in a counterbalanced manner (IO vs IG). The vertical axis shows the insulin/plasma glucose ratio minus baseline, with 0 representing baseline. Asterisks represent significantly (p≤0.05) greater responses to IO compared to IG infusions 1-min, p≤0.001; 2-min, p=0.001; 3-min, p=0.001; 5-min, p=0.002. The graph on the right shows the AUC calculated over the first 3 minutes after infusion onset for IO (filled bar) vs IG (open bar). Asterisks represent significantly (p≤0.05) greater responses to IO compared to IG infusions, p≤0.001.

Similar articles

References

    1. Spector AC. Linking gustatory neurobiology to behavior in vertebrates. Neurosci Biobehav Rev 24: 391–416, 2000. - PubMed
    1. Spector AC. The functional organization of the peripheral gustatory system: lessons from behavior. In: Progress in Psychobiology and Physiological Psychology, edited by Fluharty SJ and Grill HJ. San Diego: Academic Press, 2003.
    1. Powley TL. The ventromedial hypothalamic syndrome, satiety, and a cephalic phase hypothesis. Psychol Rev 84: 89–126, 1977. - PubMed
    1. Powley TL, Berthoud HR. Diet and cephalic phase insulin responses. Am J Clin Nutr 42: 991–1002, 1985. - PubMed
    1. Teff K Nutritional implications of the cephalic-phase reflexes: endocrine responses. Appetite 34: 206–213, 2000. - PubMed

LinkOut - more resources