

Novel insights from comprehensive analysis: The role of cuproptosis and peripheral immune infiltration in Alzheimer's disease
- PMID: 40560886
- PMCID: PMC12194219
- DOI: 10.1371/journal.pone.0325799
Novel insights from comprehensive analysis: The role of cuproptosis and peripheral immune infiltration in Alzheimer's disease
Abstract
Background: Cuproptosis is increasingly recognized as an essential factor in the pathological process of Alzheimer's disease (AD). However, the specific role of cuproptosis-related genes in AD remains poorly understood.
Methods: Our first step was to obtain gene expression data from the GEO database and identify differentially expressed cuproptosis-associated genes (DECAGs) in AD. GO, KEGG, and GSEA analyses were then conducted on these genes. Subsequently, we attempted to classify AD patients by unsupervised clustering. Then, four machine-learning models were used to screen hub-genes from the DECAGs. We also explored the immune features of these genes and predicted target drugs. Molecular docking analysis was then performed on the predicted drugs and their corresponding hub-gene related proteins. Candidate markers were then validated by single-cell analysis and intracellular communication was investigated in a GEO scRNA-seq dataset. Lastly, we examined the expression levels of the hub-genes in peripheral blood cells using real-time quantitative PCR.
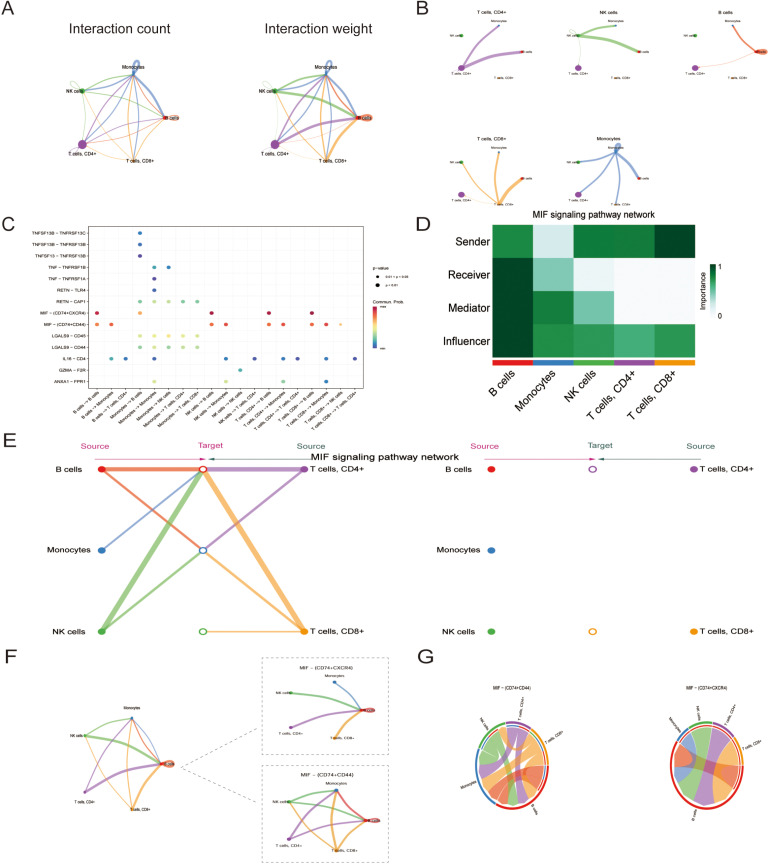
Results: 19 DECAGs were found in AD and the key biological processes and molecular functions associated with AD were further determined. Two subtypes of peripheral blood cells showed significant alternations in AD: Cluster1 and Cluster2. Five hub-genes including FDX1, GLS, PDK1, MAP2K1, and SOD1 were then screened out from the machine-learning study. All of the five hub-genes were significantly correlated with various immunocytes. We discovered compounds targeting hub-gene related proteins and forecasted multiple strong hydrogen bonding interactions between the picked predicted drugs and the target proteins by molecular docking analysis. Subsequently, in the single-cell analysis of AD peripheral blood, all hub-genes except SOD1 were found to be up-regulated in B cells, NK cells, and CD4+ T cells, possibly acting on the MIF pathway. Finally, we discovered that the levels of PDK1 expression in AD patients were remarkably upregulated, while FDX1 and GLS were significantly decreased using qPCR.
Conclusion: This study examined changes in intercellular communication between immune cells in the peripheral blood and identified five novel feature genes associated with cuproptosis in AD patients. These results facilitated a deeper understanding of the molecular mechanisms of AD and suggested novel therapeutic targets.
Copyright: © 2025 Wang et al. This is an open access article distributed under the terms of the Creative Commons Attribution License, which permits unrestricted use, distribution, and reproduction in any medium, provided the original author and source are credited.
Conflict of interest statement
The authors have declared that no competing interests exist.
Figures


Similar articles
-
Deciphering Shared Gene Signatures and Immune Infiltration Characteristics Between Gestational Diabetes Mellitus and Preeclampsia by Integrated Bioinformatics Analysis and Machine Learning.Reprod Sci. 2025 Jun;32(6):1886-1904. doi: 10.1007/s43032-025-01847-1. Epub 2025 May 15. Reprod Sci. 2025. PMID: 40374866
-
Establishment and Validation of the Diagnostic Value of Oligodendrocyterelated Genes in Alzheimer's Disease.CNS Neurol Disord Drug Targets. 2025;24(6):452-474. doi: 10.2174/0118715273339310241205055554. CNS Neurol Disord Drug Targets. 2025. PMID: 39819531
-
Systemic pharmacological treatments for chronic plaque psoriasis: a network meta-analysis.Cochrane Database Syst Rev. 2021 Apr 19;4(4):CD011535. doi: 10.1002/14651858.CD011535.pub4. Cochrane Database Syst Rev. 2021. Update in: Cochrane Database Syst Rev. 2022 May 23;5:CD011535. doi: 10.1002/14651858.CD011535.pub5. PMID: 33871055 Free PMC article. Updated.
-
Identification and analysis of cuproptosis associated molecular clusters and immunological profiles in atopic dermatitis.Front Immunol. 2025 Jun 27;16:1545457. doi: 10.3389/fimmu.2025.1545457. eCollection 2025. Front Immunol. 2025. PMID: 40655146 Free PMC article.
-
Systemic pharmacological treatments for chronic plaque psoriasis: a network meta-analysis.Cochrane Database Syst Rev. 2017 Dec 22;12(12):CD011535. doi: 10.1002/14651858.CD011535.pub2. Cochrane Database Syst Rev. 2017. Update in: Cochrane Database Syst Rev. 2020 Jan 9;1:CD011535. doi: 10.1002/14651858.CD011535.pub3. PMID: 29271481 Free PMC article. Updated.
References
MeSH terms
LinkOut - more resources
Full Text Sources
Medical
Research Materials
Miscellaneous
